

AAII Total Stock Allocation (I:AAIITSA)
71.03% for Jun 2026
Level Chart
Basic Info
|
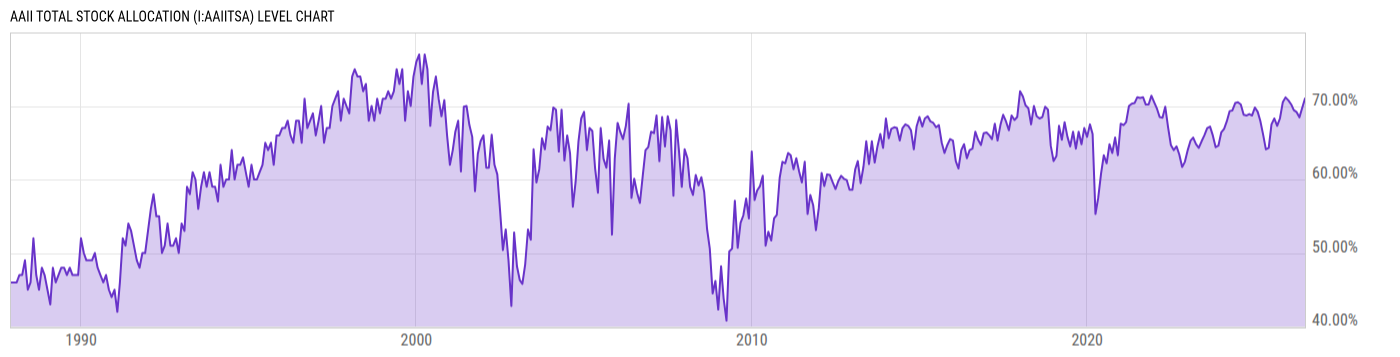
AAII Total Stock Allocation is at 71.03%, compared to 69.75% last month and 67.50% last year. This is higher than the long term average of 62.18%. |
| Report | AAII Asset Allocation Survey |
| Category | Market Indices and Statistics |
Stats
| Last Value | 71.03% |
| Latest Period | Jun 2026 |
| Last Updated | Jul 1 2026, 13:45 EDT |
| Long Term Average | 62.18% |
| Average Growth Rate | 2.84% |
| Value from Last Month | 69.75% |
| Change from Last Month | 1.83% |
| Value from 1 Year Ago | 67.50% |
| Change from 1 Year Ago | 5.23% |
| Frequency | Monthly |
| Unit | Percent |
| Adjustment | N/A |
| Formula | AAII Stock Fund Allocation + AAII Individual Stock Allocation |
Historical Data
| Date | Value |
|---|---|
| June 30, 2026 | 71.03% |
| May 31, 2026 | 69.75% |
| April 30, 2026 | 68.46% |
| March 31, 2026 | 69.16% |
| February 28, 2026 | 69.44% |
| January 31, 2026 | 70.21% |
| December 31, 2025 | 70.77% |
| November 30, 2025 | 71.17% |
| October 31, 2025 | 70.50% |
| September 30, 2025 | 68.30% |
| August 31, 2025 | 67.30% |
| July 31, 2025 | 68.30% |
| June 30, 2025 | 67.50% |
| May 31, 2025 | 64.30% |
| April 30, 2025 | 64.10% |
| March 31, 2025 | 66.10% |
| February 28, 2025 | 68.00% |
| January 31, 2025 | 69.20% |
| December 31, 2024 | 69.80% |
| November 30, 2024 | 68.70% |
| October 31, 2024 | 68.90% |
| September 30, 2024 | 68.70% |
| August 31, 2024 | 68.80% |
| July 31, 2024 | 70.20% |
| June 30, 2024 | 70.50% |
| Date | Value |
|---|---|
| May 31, 2024 | 70.40% |
| April 30, 2024 | 69.40% |
| March 31, 2024 | 69.30% |
| February 29, 2024 | 67.90% |
| January 31, 2024 | 66.90% |
| December 31, 2023 | 66.40% |
| November 30, 2023 | 64.60% |
| October 31, 2023 | 64.40% |
| September 30, 2023 | 66.00% |
| August 31, 2023 | 67.20% |
| July 31, 2023 | 67.00% |
| June 30, 2023 | 66.00% |
| May 31, 2023 | 65.20% |
| April 30, 2023 | 64.30% |
| March 31, 2023 | 64.80% |
| February 28, 2023 | 65.70% |
| January 31, 2023 | 65.30% |
| December 31, 2022 | 64.00% |
| November 30, 2022 | 62.40% |
| October 31, 2022 | 61.70% |
| September 30, 2022 | 63.40% |
| August 31, 2022 | 64.50% |
| July 31, 2022 | 64.00% |
| June 30, 2022 | 64.70% |
| May 31, 2022 | 67.10% |
News
Headline
Time (ET)
07/01 07:13
Basic Info
|
AAII Total Stock Allocation is at 71.03%, compared to 69.75% last month and 67.50% last year. This is higher than the long term average of 62.18%. |
| Report | AAII Asset Allocation Survey |
| Category | Market Indices and Statistics |
Stats
| Last Value | 71.03% |
| Latest Period | Jun 2026 |
| Last Updated | Jul 1 2026, 13:45 EDT |
| Long Term Average | 62.18% |
| Average Growth Rate | 2.84% |
| Value from Last Month | 69.75% |
| Change from Last Month | 1.83% |
| Value from 1 Year Ago | 67.50% |
| Change from 1 Year Ago | 5.23% |
| Frequency | Monthly |
| Unit | Percent |
| Adjustment | N/A |
| Formula | AAII Stock Fund Allocation + AAII Individual Stock Allocation |