

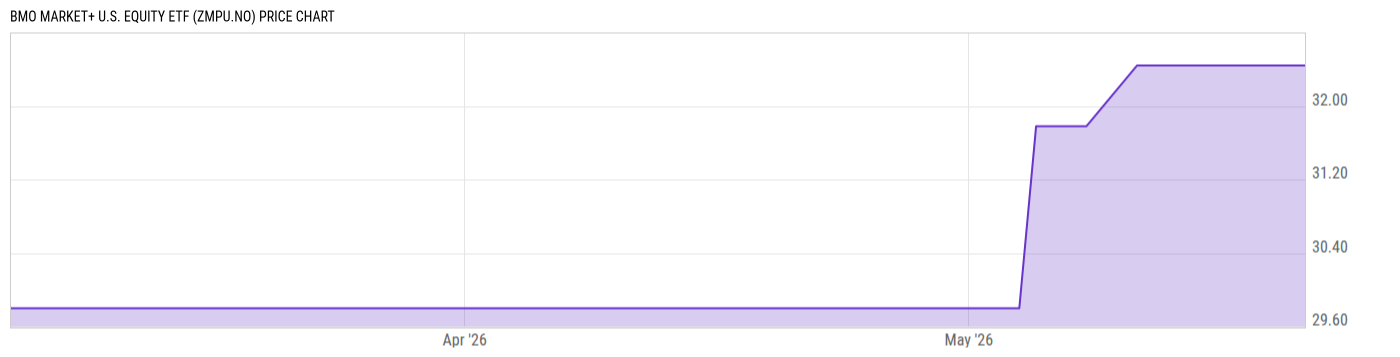
BMO Market+ U.S. Equity ETF (ZMPU.NO)
32.44
0.00 (0.00%)
CAD |
NEO |
May 15, 16:00
Price Chart
Key Stats
| Net Expense Ratio | Discount or Premium to NAV | Total Assets Under Management | 30-Day Average Daily Volume |
|---|---|---|---|
| -- | -0.36% | 4.858M | 23.33 |
| Weighted Average Dividend Yield | Turnover Ratio (Generic) | 1 Year Fund Level Flows | Max Drawdown (Since Inception) |
| 0.92% | -- | 28.33M |
Basic Info
| Investment Strategy | |
| The BMO ETF seeks to provide long-term capital appreciation by investing, directly or indirectly, in equity securities of U.S. companies that have strong fundamentals. |
| General | |
| Security Type | Exchange-Traded Fund |
| Equity Style | -- |
| Broad Asset Class | US Equity |
| Broad Category | Equity |
| Global Peer Group | Equity US |
| Peer Group | U.S. Equity |
| Global Macro | Equity North America |
| US Macro | -- |
| YCharts Categorization | -- |
| YCharts Benchmark | -- |
| Prospectus Objective | -- |
| Fund Owner Firm Name | BMO Global Asset Management |
| Broad Asset Class Benchmark Index | |
| ^SPTSX60TR | 100.0% |
Performance Versus Peer Group
Annual Total Returns Versus Peers
As of May 19, 2026.
Asset Allocation
As of April 30, 2026.
| Type | % Net |
|---|---|
| Cash | 0.62% |
| Stock | 99.20% |
| Bond | 0.00% |
| Convertible | 0.00% |
| Preferred | 0.00% |
| Other | 0.18% |
Basic Info
| Investment Strategy | |
| The BMO ETF seeks to provide long-term capital appreciation by investing, directly or indirectly, in equity securities of U.S. companies that have strong fundamentals. |
| General | |
| Security Type | Exchange-Traded Fund |
| Equity Style | -- |
| Broad Asset Class | US Equity |
| Broad Category | Equity |
| Global Peer Group | Equity US |
| Peer Group | U.S. Equity |
| Global Macro | Equity North America |
| US Macro | -- |
| YCharts Categorization | -- |
| YCharts Benchmark | -- |
| Prospectus Objective | -- |
| Fund Owner Firm Name | BMO Global Asset Management |
| Broad Asset Class Benchmark Index | |
| ^SPTSX60TR | 100.0% |