

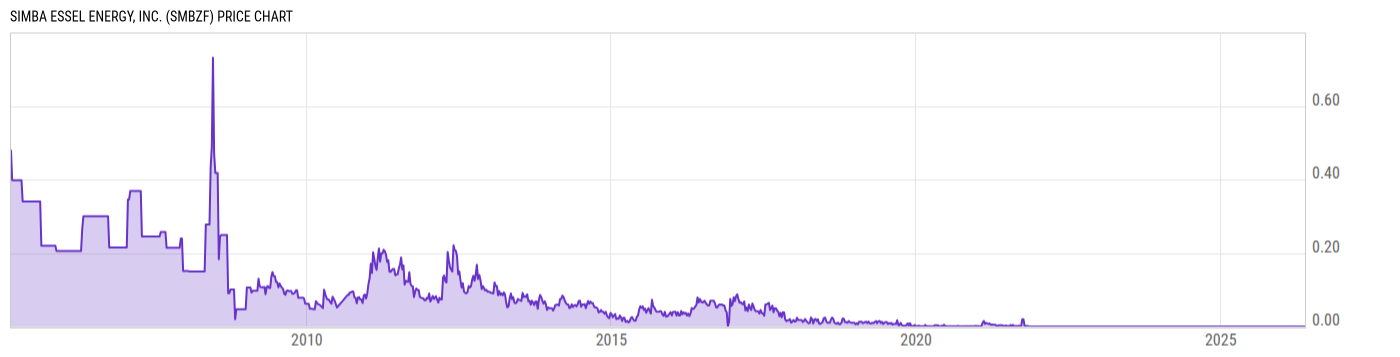
Simba Essel Energy, Inc. (SMBZF)
0.0000
0.00 (0.00%)
USD |
OTCM |
Jun 10, 16:00
Price Chart
Key Stats
| Price and Performance | |
|---|---|
| Market Cap | 0.004M |
| 52 Week High (Daily) | |
| 52 Week Low (Daily) | |
| All-Time High (Daily) | |
| Year to Date Total Returns (Daily) | |
| 1 Month Total Returns (Daily) | |
| 1 Year Total Returns (Daily) | 900.0% |
| Valuation | |
| PE Ratio | -- |
| PE Ratio (Forward) | |
| PS Ratio | -- |
| Price to Book Value | -- |
| EV to EBITDA | |
| Dividend | |
|---|---|
| Dividend | -- |
| Dividend Yield (Forward) | |
| Financials | |
| Revenue (5 Year Growth) | |
| Revenue (Quarterly YoY Growth) | |
| EPS Diluted (5 Year Growth) | |
| EPS Diluted (Quarterly YoY Growth) | |
| Debt to Equity Ratio | -- |
| Return on Equity | |
| Return on Assets | |
| Risk | |
| Beta (5Y) | |
| Max Drawdown (5Y) | 100.00% |
Profile
| Simba Essel Energy, Inc. is an oil and gas exploration company that focuses on onshore Pan-African opportunities. Its portfolio comprises of onshore Production Sharing Contracts in Kenya, Chad, and Guinea, and applications for an onshore permit in Ghana and an onshore and offshore permit in Liberia. The company was founded by Hassan Hassan on September 19, 1990 and is headquartered in Vancouver, Canada. |
| URL | N/A |
| Investor Relations URL | http://www.simbaenergy.ca/investors.aspx |
| HQ State/Province | British Columbia |
| Sector | Energy |
| Industry | Oil, Gas & Consumable Fuels |
| Equity Style | Small Cap Value |
| Next Earnings Release | N/A |
| Last Earnings Release | N/A |
| Next Ex-Dividend Date | N/A |
| Last Ex-Dividend Date | N/A |