

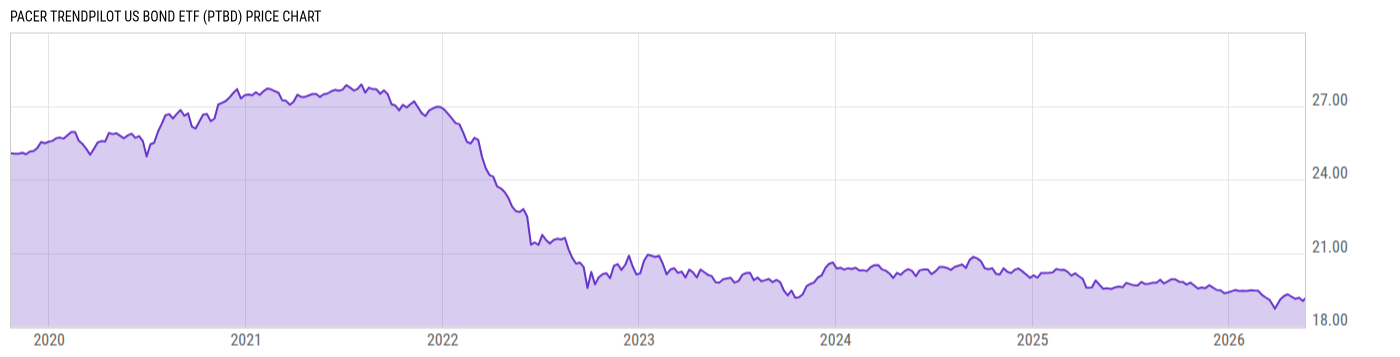
Pacer Trendpilot US Bond ETF (PTBD)
19.06
+0.03
(+0.16%)
USD |
NYSEARCA |
May 20, 16:00
19.06
0.00 (0.00%)
After-Hours: 19:13
Price Chart
Key Stats
| Net Expense Ratio | Discount or Premium to NAV | Total Assets Under Management | 30-Day Average Daily Volume |
|---|---|---|---|
| 0.60% | -0.13% | 85.75M | 26674.70 |
| Weighted Average Dividend Yield | Turnover Ratio (Generic) | 1 Year Fund Level Flows | Max Drawdown (Since Inception) |
| -- | 431.0% | -69.37M |
Basic Info
| Investment Strategy | |
| The Fund seeks to track the total return performance of the Pacer Trendpilot US Bond Index. The Fund invests at least 80% of its assets in the securities of the Index which directs exposure to S&P US High Yield Corporate Bond Index and S&P US Treasury Bond 7-10 Year Index in different positions based on the Risk Ratio. |
| General | |
| Security Type | Exchange-Traded Fund |
| Equity Style | -- |
| Broad Asset Class | Taxable Bond |
| Broad Category | Fixed Income |
| Global Peer Group | Bond Other |
| Peer Group | Specialty Fixed Income Funds |
| Global Macro | Bond Other |
| US Macro | General Domestic Taxable Fixed Income Funds |
| YCharts Categorization | -- |
| YCharts Benchmark | -- |
| Prospectus Objective | Specialty Fixed Income Funds |
| Fund Owner Firm Name | Pacer |
| Broad Asset Class Benchmark Index | |
| ^BBUSATR | 100.0% |
Performance Versus Peer Group
Annual Total Returns Versus Peers
As of May 20, 2026.
Asset Allocation
As of April 30, 2026.
| Type | % Net |
|---|---|
| Cash | 4.13% |
| Stock | 0.00% |
| Bond | 96.32% |
| Convertible | 0.00% |
| Preferred | 0.00% |
| Other | -0.45% |
Basic Info
| Investment Strategy | |
| The Fund seeks to track the total return performance of the Pacer Trendpilot US Bond Index. The Fund invests at least 80% of its assets in the securities of the Index which directs exposure to S&P US High Yield Corporate Bond Index and S&P US Treasury Bond 7-10 Year Index in different positions based on the Risk Ratio. |
| General | |
| Security Type | Exchange-Traded Fund |
| Equity Style | -- |
| Broad Asset Class | Taxable Bond |
| Broad Category | Fixed Income |
| Global Peer Group | Bond Other |
| Peer Group | Specialty Fixed Income Funds |
| Global Macro | Bond Other |
| US Macro | General Domestic Taxable Fixed Income Funds |
| YCharts Categorization | -- |
| YCharts Benchmark | -- |
| Prospectus Objective | Specialty Fixed Income Funds |
| Fund Owner Firm Name | Pacer |
| Broad Asset Class Benchmark Index | |
| ^BBUSATR | 100.0% |