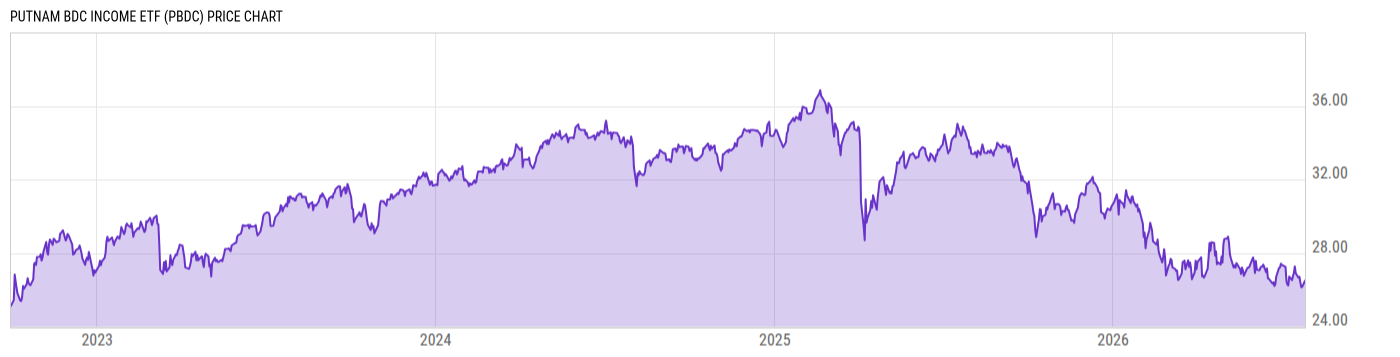
Key Stats

Expense Ratio Discount or Premium to NAV Total Assets Under Management 30-Day Average Daily Volume
10.61% -0.05% 27.17M 3884.23
Dividend Yield Turnover Ratio 1 Year Fund Level Flows Max Drawdown (All)
3.02% 10.00% -- Upgrade

Basic Info

Investment Strategy
The investment seeks current income. The fund invests mainly in exchange-traded business development companies (“BDCs”). BDCs are vehicles whose principal business is to invest in, lend capital to or provide services to privately-held U.S. companies or thinly traded U.S. public companies. The fund is non-diversified.
General
Security Type Exchange-Traded Fund
Equity Style Small Cap/Value
Fixed Income Style --
Broad Asset Class Sector Equity
Broad Category Equity
Category Name Financial
Category Index --
Global Category Name Financials Sector Equity
YCharts Categorization Financials Equity
YCharts Benchmark S&P 1500 Financials (Sector) Total Return (^SP15FINSTR)
Prospectus Objective Growth and Income
Fund Owner Firm Name Putnam
Prospectus Benchmark Index
N/A 100.0%
Broad Asset Class Benchmark Index
^MSWNTR 100.0%
Manager Tenure
Michael Petro 0.42 yrs

Net Fund Flows Versus Category

View Net Fund Flows. Upgrade now.
1M
3M
6M
YTD
1Y
3Y
5Y
10Y
 
80.00B
60.00B
40.00B
20.00B
0
-20.00B
1 Month
% Rank: --
-- Category Low
-- Category High
1 Year
% Rank: --
-8.898B Category Low
804.86M Category High
3 Months
% Rank: --
-- Category Low
-- Category High
3 Years
% Rank: --
-- Category Low
-- Category High
6 Months
% Rank: --
-- Category Low
-- Category High
5 Years
% Rank: --
-- Category Low
-- Category High
YTD
% Rank: --
-- Category Low
-- Category High
10 Years
% Rank: --
-- Category Low
-- Category High
As of January 31, 2023

Performance Versus Category

 
20%
15%
10%
5%
0
View Category Returns. Upgrade now.
Name
1M
3M
YTD
1Y
3Y
5Y
10Y
15Y
Total Return (Price)
--
--
--
--
--
--
--
--
Total Return (NAV)
--
--
--
--
--
--
--
--
Category Rtn. (NAV)
--
--
--
--
--
--
--
--
% Rank in Cat (NAV)
--
--
--
--
--
--
--
--
As of March 24, 2023. Returns for periods of 1 year and above are annualized.

Annual Total Returns Versus Peers

Loading chart...
Name
2016
2017
2018
2019
2020
2021
2022
YTD
--
--
--
--
--
--
--
2.53%
7.51%
22.40%
-8.71%
27.67%
15.90%
21.82%
-18.14%
3.82%
41.75%
-4.15%
-5.01%
27.82%
-41.60%
42.28%
-17.90%
0.86%
24.88%
0.34%
-6.90%
30.88%
-6.84%
36.16%
-8.63%
1.77%
32.51%
6.69%
-8.43%
22.10%
-8.89%
27.84%
-19.36%
-11.61%
20.48%
12.04%
-8.68%
20.70%
-15.44%
31.91%
-19.14%
-1.83%
As of March 24, 2023.

Fundamentals

General
Distribution Yield Upgrade
Dividend Yield TTM (3-24-23) 3.02%
30-Day SEC Yield --
7-Day SEC Yield --
Number of Holdings Upgrade
Stock
Weighted Average PE Ratio 14.06
Weighted Average Price to Sales Ratio Upgrade
Weighted Average Price to Book Ratio Upgrade
Weighted Median ROE Upgrade
Weighted Median ROA Upgrade
Forecasted Dividend Yield Upgrade
Forecasted PE Ratio Upgrade
Forecasted Price to Sales Ratio Upgrade
Forecasted Price to Book Ratio Upgrade
As of February 28, 2023

Growth Estimates

Forecasted 5 Yr Earnings Growth --
Forecasted Book Value Growth Upgrade
Forecasted Cash Flow Growth --
Forecasted Earnings Growth Upgrade
Forecasted Revenue Growth Upgrade
As of February 28, 2023

Asset Allocation

As of February 28, 2023.
Type % Net % Long % Short
Cash -0.40% Upgrade Upgrade
Stock 100.4% Upgrade Upgrade
Bond 0.00% Upgrade Upgrade
Convertible 0.00% Upgrade Upgrade
Preferred 0.00% Upgrade Upgrade
Other 0.00% Upgrade Upgrade

Top 10 Holdings

Name % Weight Price % Change
Owl Rock Capital Corp Ordinary Shares 13.51% 12.34 0.57%
Blackstone Secured Lending Fund Ordinary Shares 12.35% 24.96 -1.73%
Ares Capital Corp 10.69% 17.54 2.04%
Golub Capital BDC Inc Class B 9.46% 13.00 2.36%
Hercules Capital Inc 5.02% 12.46 2.30%
Main Street Capital Corp 4.93% 39.28 1.60%
CION Invt Corp Ordinary Shares 4.78% 9.73 1.99%
Sixth Street Specialty Lending Inc 4.69% 17.61 1.67%
Barings BDC Inc 4.41% 7.76 1.17%
FS KKR Capital Corp 4.30% 18.10 1.29%

News

Headline
Wire
Time (ET)
No Data Available

Basic Info

Investment Strategy
The investment seeks current income. The fund invests mainly in exchange-traded business development companies (“BDCs”). BDCs are vehicles whose principal business is to invest in, lend capital to or provide services to privately-held U.S. companies or thinly traded U.S. public companies. The fund is non-diversified.
General
Security Type Exchange-Traded Fund
Equity Style Small Cap/Value
Fixed Income Style --
Broad Asset Class Sector Equity
Broad Category Equity
Category Name Financial
Category Index --
Global Category Name Financials Sector Equity
YCharts Categorization Financials Equity
YCharts Benchmark S&P 1500 Financials (Sector) Total Return (^SP15FINSTR)
Prospectus Objective Growth and Income
Fund Owner Firm Name Putnam
Prospectus Benchmark Index
N/A 100.0%
Broad Asset Class Benchmark Index
^MSWNTR 100.0%
Manager Tenure
Michael Petro 0.42 yrs

Fundamentals

General
Distribution Yield Upgrade
Dividend Yield TTM (3-24-23) 3.02%
30-Day SEC Yield --
7-Day SEC Yield --
Number of Holdings Upgrade
Stock
Weighted Average PE Ratio 14.06
Weighted Average Price to Sales Ratio Upgrade
Weighted Average Price to Book Ratio Upgrade
Weighted Median ROE Upgrade
Weighted Median ROA Upgrade
Forecasted Dividend Yield Upgrade
Forecasted PE Ratio Upgrade
Forecasted Price to Sales Ratio Upgrade
Forecasted Price to Book Ratio Upgrade
As of February 28, 2023

Growth Estimates

Forecasted 5 Yr Earnings Growth --
Forecasted Book Value Growth Upgrade
Forecasted Cash Flow Growth --
Forecasted Earnings Growth Upgrade
Forecasted Revenue Growth Upgrade
As of February 28, 2023

Fund Details

Key Dates
Inception Date 9/29/2022
Last Annual Report Date 10/31/2022
Last Prospectus Date 9/28/2022
Attributes
Index Fund No
Inverse Fund No
Leveraged Fund No
Fund of Funds No
Currency Hedged Fund No
Synthetic Replication Fund No
Has Dividend Investment Plan No
Socially Responsible Fund No

News

Headline
Wire
Time (ET)
No Data Available

Top Portfolio Holders

0 of 0