

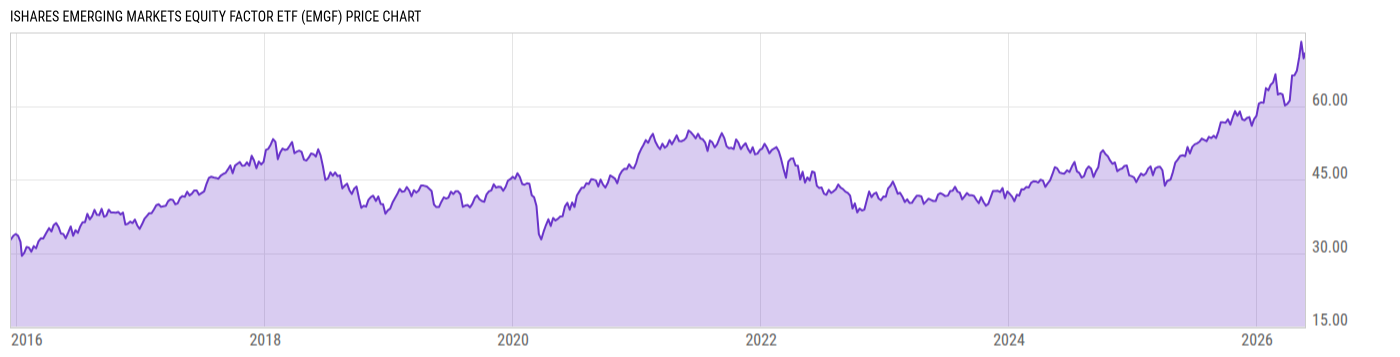
iShares Emerging Markets Equity Factor ETF (EMGF)
70.57
-0.27
(-0.38%)
USD |
BATS |
Jun 10, 09:36
Price Chart
Key Stats
| Net Expense Ratio | Discount or Premium to NAV | Total Assets Under Management | 30-Day Average Daily Volume |
|---|---|---|---|
| 0.26% | -0.58% | 1.860B | 160860.1 |
| Weighted Average Dividend Yield | Turnover Ratio (Generic) | 1 Year Fund Level Flows | Max Drawdown (Since Inception) |
| 2.24% | 20.00% | 483.54M |
Basic Info
| Investment Strategy | |
| The Fund seeks to track the investment results of the MSCI Emerging Markets Diversified Multiple-Factor Index that is composed of stocks of large- and mid-capitalization companies in emerging markets that have favorable exposure to target style factors (value, quality, momentum and low size) subject to constraints. |
| General | |
| Security Type | Exchange-Traded Fund |
| Equity Style | Large Cap Core |
| Broad Asset Class | International Equity |
| Broad Category | Equity |
| Global Peer Group | Equity Emerging Markets Global |
| Peer Group | Emerging Markets Funds |
| Global Macro | Equity Emerging Markets |
| US Macro | Emerging Markets Equity Funds |
| YCharts Categorization | -- |
| YCharts Benchmark | -- |
| Prospectus Objective | Emerging Markets Funds |
| Fund Owner Firm Name | BlackRock |
| Broad Asset Class Benchmark Index | |
| ^MSACXUSNTR | 100.0% |
Performance Versus Peer Group
Annual Total Returns Versus Peers
As of June 10, 2026.
Asset Allocation
As of April 30, 2026.
| Type | % Net |
|---|---|
| Cash | -0.04% |
| Stock | 97.82% |
| Bond | 0.15% |
| Convertible | 0.00% |
| Preferred | 1.28% |
| Other | 0.80% |
Basic Info
| Investment Strategy | |
| The Fund seeks to track the investment results of the MSCI Emerging Markets Diversified Multiple-Factor Index that is composed of stocks of large- and mid-capitalization companies in emerging markets that have favorable exposure to target style factors (value, quality, momentum and low size) subject to constraints. |
| General | |
| Security Type | Exchange-Traded Fund |
| Equity Style | Large Cap Core |
| Broad Asset Class | International Equity |
| Broad Category | Equity |
| Global Peer Group | Equity Emerging Markets Global |
| Peer Group | Emerging Markets Funds |
| Global Macro | Equity Emerging Markets |
| US Macro | Emerging Markets Equity Funds |
| YCharts Categorization | -- |
| YCharts Benchmark | -- |
| Prospectus Objective | Emerging Markets Funds |
| Fund Owner Firm Name | BlackRock |
| Broad Asset Class Benchmark Index | |
| ^MSACXUSNTR | 100.0% |