

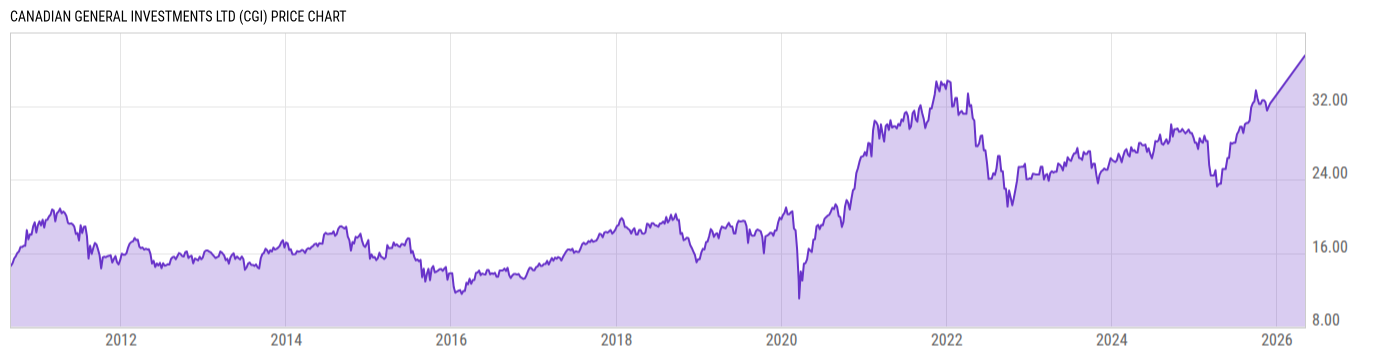
Canadian General Investments Ltd (CGI)
37.50
+3.79
(+11.25%)
CAD |
OTCM |
May 05, 15:59
Price Chart
Key Stats
| Net Expense Ratio | Discount or Premium to NAV | Total Assets Under Management | 30-Day Average Daily Volume |
|---|---|---|---|
| -- | -- | -- | -- |
| Weighted Average Dividend Yield | Turnover Ratio (Generic) | 1 Year Fund Level Flows | Max Drawdown (Since Inception) |
| -- | -- | -- |
Basic Info
| Investment Strategy | |
| -- |
| General | |
| Security Type | Closed-End Fund |
| Equity Style | Multi Cap Growth |
| Broad Asset Class | -- |
| Broad Category | -- |
| Global Peer Group | Equity Canada |
| Peer Group | Developed Market Funds |
| Global Macro | Equity North America |
| US Macro | Developed International Markets Funds |
| YCharts Categorization | -- |
| YCharts Benchmark | -- |
| Prospectus Objective | -- |
| Fund Owner Firm Name | Morgan Meighen & Associates |
| Broad Asset Class Benchmark Index | |
| ^SPTSX60TR | 100.0% |
Performance Versus Peer Group
Annual Total Returns Versus Peers
As of May 10, 2026.
*Indicates data for the year is incomplete.
Asset Allocation
| Type | % Net |
|---|
Basic Info
| Investment Strategy | |
| -- |
| General | |
| Security Type | Closed-End Fund |
| Equity Style | Multi Cap Growth |
| Broad Asset Class | -- |
| Broad Category | -- |
| Global Peer Group | Equity Canada |
| Peer Group | Developed Market Funds |
| Global Macro | Equity North America |
| US Macro | Developed International Markets Funds |
| YCharts Categorization | -- |
| YCharts Benchmark | -- |
| Prospectus Objective | -- |
| Fund Owner Firm Name | Morgan Meighen & Associates |
| Broad Asset Class Benchmark Index | |
| ^SPTSX60TR | 100.0% |