

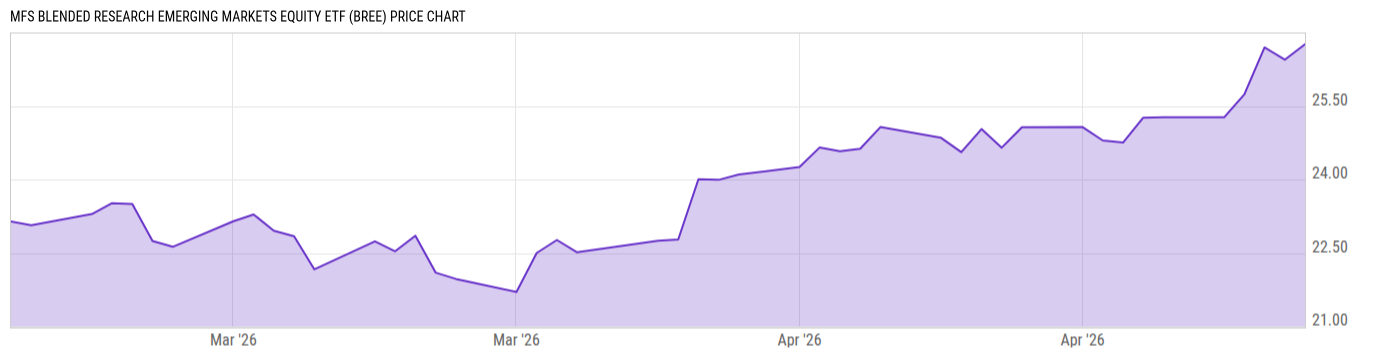
MFS Blended Research Emerging Markets Equity ETF (BREE)
26.76
+0.31
(+1.19%)
USD |
NYSE |
May 08, 16:00
Price Chart
Key Stats
| Net Expense Ratio | Discount or Premium to NAV | Total Assets Under Management | 30-Day Average Daily Volume |
|---|---|---|---|
| 0.44% | 1.13% | 25.14M | 5583.37 |
| Weighted Average Dividend Yield | Turnover Ratio (Generic) | 1 Year Fund Level Flows | Max Drawdown (Since Inception) |
| 3.23% | -- | 106.56M |
Basic Info
| Investment Strategy | |
| The Fund seeks capital appreciation. MFS normally invests at least 80% of the funds net assets in equity securities of issuers that are tied economically to emerging market countries. The Fund pays transaction costs, such as commissions, when it buys and sells securities or turns over its portfolio. |
| General | |
| Security Type | Exchange-Traded Fund |
| Equity Style | -- |
| Broad Asset Class | International Equity |
| Broad Category | Equity |
| Global Peer Group | Equity Emerging Markets Global |
| Peer Group | Emerging Markets Funds |
| Global Macro | Equity Emerging Markets |
| US Macro | Emerging Markets Equity Funds |
| YCharts Categorization | -- |
| YCharts Benchmark | -- |
| Prospectus Objective | Emerging Markets Funds |
| Fund Owner Firm Name | MFS |
| Broad Asset Class Benchmark Index | |
| ^MSACXUSNTR | 100.0% |
Performance Versus Peer Group
Annual Total Returns Versus Peers
As of May 10, 2026.
Asset Allocation
As of March 31, 2026.
| Type | % Net |
|---|---|
| Cash | 1.39% |
| Stock | 96.76% |
| Bond | 0.00% |
| Convertible | 0.00% |
| Preferred | 1.85% |
| Other | 0.00% |
Basic Info
| Investment Strategy | |
| The Fund seeks capital appreciation. MFS normally invests at least 80% of the funds net assets in equity securities of issuers that are tied economically to emerging market countries. The Fund pays transaction costs, such as commissions, when it buys and sells securities or turns over its portfolio. |
| General | |
| Security Type | Exchange-Traded Fund |
| Equity Style | -- |
| Broad Asset Class | International Equity |
| Broad Category | Equity |
| Global Peer Group | Equity Emerging Markets Global |
| Peer Group | Emerging Markets Funds |
| Global Macro | Equity Emerging Markets |
| US Macro | Emerging Markets Equity Funds |
| YCharts Categorization | -- |
| YCharts Benchmark | -- |
| Prospectus Objective | Emerging Markets Funds |
| Fund Owner Firm Name | MFS |
| Broad Asset Class Benchmark Index | |
| ^MSACXUSNTR | 100.0% |