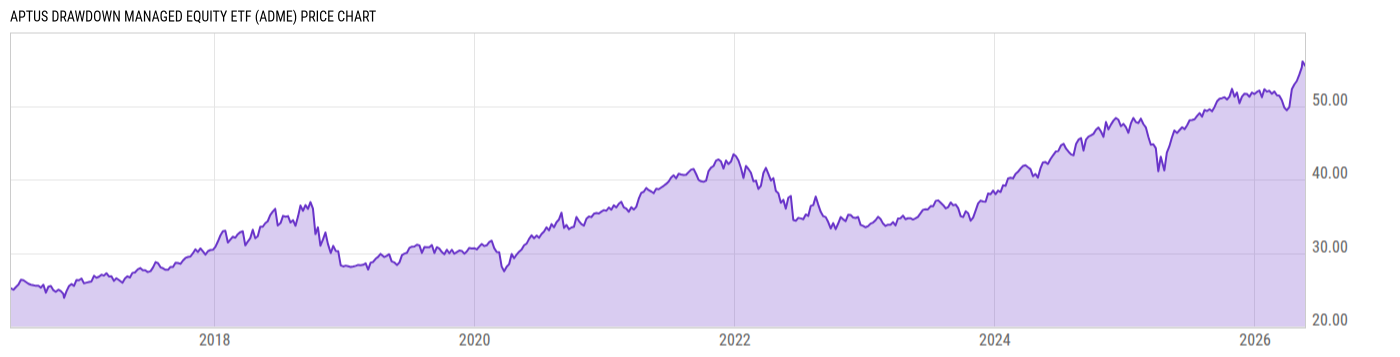
Aptus Drawdown Managed Equity ETF (ADME)
34.02
+0.06
(+0.18%)
USD |
BATS |
Mar 21, 16:00
34.02
0.00 (0.00%)
After-Hours: 20:00
Key Stats
Expense Ratio | Discount or Premium to NAV | Total Assets Under Management | 30-Day Average Daily Volume |
---|---|---|---|
0.79% | 0.03% | 235.67M | 58852.87 |
Dividend Yield | Turnover Ratio | 1 Year Fund Level Flows | Max Drawdown (All) |
0.65% | 43.00% | -67.60M | Upgrade |
Basic Info
Investment Strategy | |
The investment seeks capital appreciation with downside protection. The fund is an actively managed exchange-traded fund ("ETF") that seeks to achieve its objective principally by investing in a portfolio of U.S.-listed equity securities, while limiting downside risk by purchasing exchange-listed put options on one or more of such equity securities or on broad-based indexes or ETFs that track the performance of the U.S. equity market. Under normal circumstances, at least 80% of the fund's net assets (plus borrowings for investment purposes) will be invested in equity securities. |
General | |
Security Type | Exchange-Traded Fund |
Equity Style | Large Cap/Growth |
Fixed Income Style | -- |
Broad Asset Class | Nontraditional Equity |
Broad Category | Equity |
Category Name | Long-Short Equity |
Category Index | MSCI ACWI NR USD |
Global Category Name | Long/Short Equity |
YCharts Categorization | Other |
YCharts Benchmark | S&P 500 Total Return (^SPXTR) |
Prospectus Objective | Growth and Income |
Fund Owner Firm Name | APTUS ETFs |
Prospectus Benchmark Index | |
S&P 500 TR USD | 100.0% |
Broad Asset Class Benchmark Index | |
^SPXTR | 100.0% |
Manager Tenure | |
John Gardner | 5.50 yrs |
David Wagner | 2.50 yrs |
John Tyner | 2.50 yrs |
Net Fund Flows Versus Category
1 Month
% Rank:
--
--
Category Low
--
Category High
1 Year
% Rank:
83
-67.60M
-267.41M
Category Low
472.43M
Category High
3 Months
% Rank:
--
--
Category Low
--
Category High
3 Years
% Rank:
--
--
Category Low
--
Category High
6 Months
% Rank:
--
--
Category Low
--
Category High
5 Years
% Rank:
--
--
Category Low
--
Category High
YTD
% Rank:
--
--
Category Low
--
Category High
10 Years
% Rank:
--
--
Category Low
--
Category High
As of February 28, 2023
Risk
Performance Versus Category
As of March 20, 2023. Returns for periods of 1 year and above are annualized.
Annual Total Returns Versus Peers
As of March 20, 2023.
Asset Allocation
Top 10 Holdings
Name | % Weight | Price | % Change |
---|---|---|---|
Apple Inc | 6.98% | 159.40 | 1.27% |
Microsoft Corp | 6.17% | 273.78 | 0.57% |
Alphabet Inc Class C | 3.41% | 105.75 | 3.75% |
Option on S&P 500 PR
|
2.77% | -- | -- |
Amazon.com Inc | 2.65% | 100.61 | 2.97% |
Option on S&P 500 PR
|
2.62% | -- | -- |
Exxon Mobil Corp | 2.02% | 107.06 | 4.50% |
NVIDIA Corp | 1.91% | 261.55 | 0.98% |
CBOE S&P PUT OPT 03/23 3825
|
1.90% | -- | -- |
Lockheed Martin Corp | 1.89% | 474.84 | -0.18% |
News
Headline
Wire
Time (ET)
Basic Info
Investment Strategy | |
The investment seeks capital appreciation with downside protection. The fund is an actively managed exchange-traded fund ("ETF") that seeks to achieve its objective principally by investing in a portfolio of U.S.-listed equity securities, while limiting downside risk by purchasing exchange-listed put options on one or more of such equity securities or on broad-based indexes or ETFs that track the performance of the U.S. equity market. Under normal circumstances, at least 80% of the fund's net assets (plus borrowings for investment purposes) will be invested in equity securities. |
General | |
Security Type | Exchange-Traded Fund |
Equity Style | Large Cap/Growth |
Fixed Income Style | -- |
Broad Asset Class | Nontraditional Equity |
Broad Category | Equity |
Category Name | Long-Short Equity |
Category Index | MSCI ACWI NR USD |
Global Category Name | Long/Short Equity |
YCharts Categorization | Other |
YCharts Benchmark | S&P 500 Total Return (^SPXTR) |
Prospectus Objective | Growth and Income |
Fund Owner Firm Name | APTUS ETFs |
Prospectus Benchmark Index | |
S&P 500 TR USD | 100.0% |
Broad Asset Class Benchmark Index | |
^SPXTR | 100.0% |
Manager Tenure | |
John Gardner | 5.50 yrs |
David Wagner | 2.50 yrs |
John Tyner | 2.50 yrs |
Fundamentals
General | |
Distribution Yield | Upgrade |
Dividend Yield TTM (3-21-23) | 0.65% |
30-Day SEC Yield (10-31-19) | Upgrade |
7-Day SEC Yield | -- |
Number of Holdings | Upgrade |
Stock | |
Weighted Average PE Ratio | 21.29 |
Weighted Average Price to Sales Ratio | Upgrade |
Weighted Average Price to Book Ratio | Upgrade |
Weighted Median ROE | Upgrade |
Weighted Median ROA | Upgrade |
Forecasted Dividend Yield | Upgrade |
Forecasted PE Ratio | Upgrade |
Forecasted Price to Sales Ratio | Upgrade |
Forecasted Price to Book Ratio | Upgrade |
As of March 16, 2023
Fund Details
Key Dates | |
Inception Date | 6/8/2016 |
Last Annual Report Date | 4/30/2022 |
Last Prospectus Date | 8/31/2022 |
Attributes | |
Index Fund | No |
Inverse Fund | No |
Leveraged Fund | No |
Fund of Funds | No |
Currency Hedged Fund | No |
Synthetic Replication Fund | No |
Has Dividend Investment Plan | No |
Socially Responsible Fund | No |
News
Headline
Wire
Time (ET)