

Wilshire 5000 Total Market Index (DISCONTINUED) (I:W5000TMI)
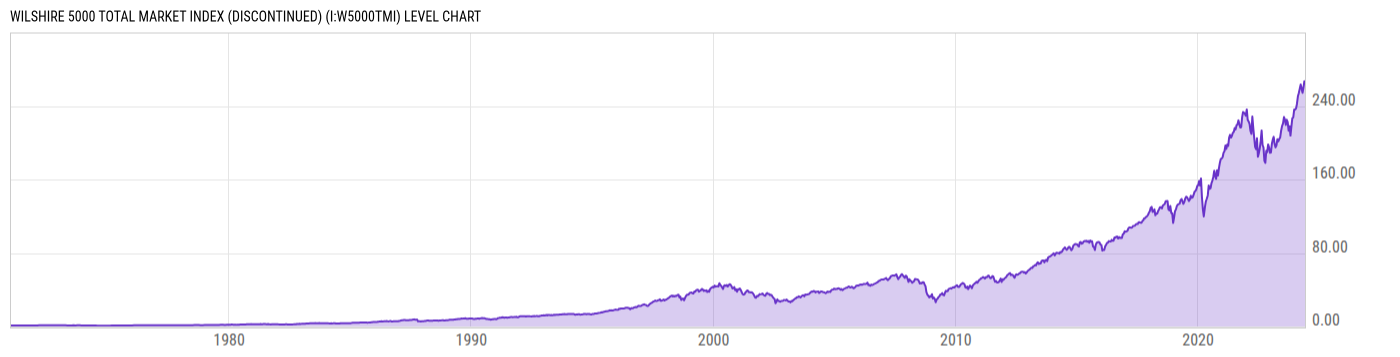
264.24 USD for May 31 2024
Level Chart
Basic Info
|
Wilshire 5000 Total Market Index is at a current level of 264.24, up from 262.30 the previous market day and up from 209.18 one year ago. This is a change of 0.74% from the previous market day and 26.32% from one year ago. |
| Report | Wilshire Indexes |
| Category | Market Indices and Statistics |
| Region | United States |
| Source | Wilshire |
Stats
| Last Value | 264.24 |
| Latest Period | May 31 2024 |
| Last Updated | Jun 3 2024, 08:06 EDT |
| Average Growth Rate | 14.21% |
| Value from The Previous Market Day | 262.30 |
| Change from The Previous Market Day | 0.74% |
| Value from 1 Year Ago | 209.18 |
| Change from 1 Year Ago | 26.32% |
| Frequency | Market Daily |
| Unit | USD |
| Adjustment | N/A |
| Notes | Wilshire 5000 index that includes reinvested dividends |
Historical Data
| Date | Value |
|---|---|
| May 31, 2024 | 264.24 |
| May 30, 2024 | 262.30 |
| May 29, 2024 | 263.48 |
| May 28, 2024 | 265.57 |
| May 24, 2024 | 265.70 |
| May 23, 2024 | 263.78 |
| May 22, 2024 | 266.03 |
| May 21, 2024 | 266.91 |
| May 20, 2024 | 266.43 |
| May 17, 2024 | 266.07 |
| May 16, 2024 | 265.78 |
| May 15, 2024 | 266.47 |
| May 14, 2024 | 263.36 |
| May 13, 2024 | 261.86 |
| May 10, 2024 | 261.91 |
| May 09, 2024 | 261.61 |
| May 08, 2024 | 260.11 |
| May 07, 2024 | 260.28 |
| May 06, 2024 | 260.03 |
| May 03, 2024 | 257.24 |
| May 02, 2024 | 254.17 |
| May 01, 2024 | 251.66 |
| April 30, 2024 | 252.32 |
| April 29, 2024 | 256.50 |
| April 26, 2024 | 255.62 |
| Date | Value |
|---|---|
| April 25, 2024 | 253.11 |
| April 24, 2024 | 254.29 |
| April 23, 2024 | 254.29 |
| April 22, 2024 | 251.08 |
| April 19, 2024 | 248.86 |
| April 18, 2024 | 250.75 |
| April 17, 2024 | 251.28 |
| April 16, 2024 | 252.82 |
| April 15, 2024 | 253.44 |
| April 12, 2024 | 256.68 |
| April 11, 2024 | 260.56 |
| April 10, 2024 | 258.69 |
| April 09, 2024 | 261.49 |
| April 08, 2024 | 261.07 |
| April 05, 2024 | 260.98 |
| April 04, 2024 | 258.20 |
| April 03, 2024 | 261.33 |
| April 02, 2024 | 260.91 |
| April 01, 2024 | 263.06 |
| March 28, 2024 | 263.81 |
| March 27, 2024 | 263.45 |
| March 26, 2024 | 260.97 |
| March 25, 2024 | 261.60 |
| March 22, 2024 | 262.27 |
| March 21, 2024 | 262.90 |
News
Headline
Time (ET)
Basic Info
|
Wilshire 5000 Total Market Index is at a current level of 264.24, up from 262.30 the previous market day and up from 209.18 one year ago. This is a change of 0.74% from the previous market day and 26.32% from one year ago. |
| Report | Wilshire Indexes |
| Category | Market Indices and Statistics |
| Region | United States |
| Source | Wilshire |
Stats
| Last Value | 264.24 |
| Latest Period | May 31 2024 |
| Last Updated | Jun 3 2024, 08:06 EDT |
| Average Growth Rate | 14.21% |
| Value from The Previous Market Day | 262.30 |
| Change from The Previous Market Day | 0.74% |
| Value from 1 Year Ago | 209.18 |
| Change from 1 Year Ago | 26.32% |
| Frequency | Market Daily |
| Unit | USD |
| Adjustment | N/A |
| Notes | Wilshire 5000 index that includes reinvested dividends |