

US Rig Count (I:USRR)
Level Chart
Basic Info
|
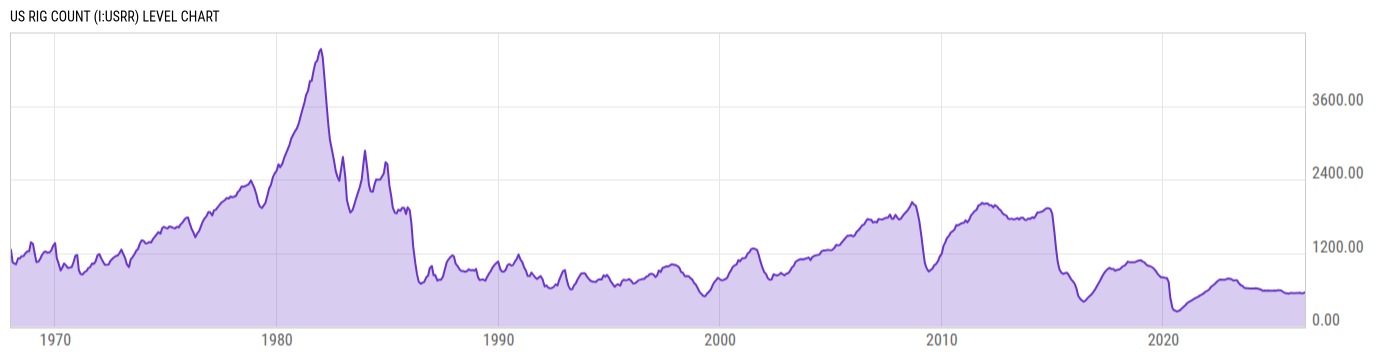
US Rig Count is at a current level of 558.00, up from 551.00 last week and down from 576.00 one year ago. This is a change of 1.27% from last week and -3.12% from one year ago. |
|
US Rig Count, displays the number of active drilling rigs throughout the United States. The indicator is closely watched as a precursor to oil production in the US oil and gas production industry. Throughout the mid 2010s, US rig counts reached a low of 404 active drilling rigs in May 2016 following significant decreases in oil prices from previous years, then started to rebound as oil prices started to rise again and improvements in drilling technology made previously uneconomical oil deposits viable. |
| Report | Baker Hughes North American Rotary Rig Count |
| Category | Energy |
| Region | United States |
| Source | Baker Hughes |
Stats
| Last Value | 558.00 |
| Latest Period | May 22 2026 |
| Last Updated | May 22 2026, 13:03 EDT |
| Next Release | May 29 2026, 13:00 EDT |
| Average Growth Rate | -0.38% |
| Value from Last Week | 551.00 |
| Change from Last Week | 1.27% |
| Value from 1 Year Ago | 576.00 |
| Change from 1 Year Ago | -3.12% |
| Frequency | Weekly |
| Adjustment | N/A |
| Download Source File |
Historical Data
| Date | Value |
|---|---|
| May 22, 2026 | 558.00 |
| May 15, 2026 | 551.00 |
| May 08, 2026 | 548.00 |
| May 01, 2026 | 547.00 |
| April 24, 2026 | 544.00 |
| April 17, 2026 | 543.00 |
| April 10, 2026 | 545.00 |
| April 02, 2026 | 548.00 |
| March 27, 2026 | 543.00 |
| March 20, 2026 | 552.00 |
| March 13, 2026 | 553.00 |
| March 06, 2026 | 551.00 |
| February 27, 2026 | 550.00 |
| February 20, 2026 | 551.00 |
| February 13, 2026 | 551.00 |
| February 06, 2026 | 551.00 |
| January 30, 2026 | 546.00 |
| January 23, 2026 | 544.00 |
| January 16, 2026 | 543.00 |
| January 09, 2026 | 544.00 |
| January 02, 2026 | 546.00 |
| December 23, 2025 | 545.00 |
| December 19, 2025 | 542.00 |
| December 12, 2025 | 548.00 |
| December 05, 2025 | 549.00 |
| Date | Value |
|---|---|
| November 26, 2025 | 544.00 |
| November 21, 2025 | 554.00 |
| November 14, 2025 | 549.00 |
| November 07, 2025 | 548.00 |
| October 31, 2025 | 546.00 |
| October 24, 2025 | 550.00 |
| October 17, 2025 | 548.00 |
| October 10, 2025 | 547.00 |
| October 03, 2025 | 549.00 |
| September 26, 2025 | 549.00 |
| September 19, 2025 | 542.00 |
| September 12, 2025 | 539.00 |
| September 05, 2025 | 537.00 |
| August 29, 2025 | 536.00 |
| August 22, 2025 | 538.00 |
| August 15, 2025 | 539.00 |
| August 08, 2025 | 539.00 |
| August 01, 2025 | 540.00 |
| July 25, 2025 | 542.00 |
| July 18, 2025 | 544.00 |
| July 11, 2025 | 537.00 |
| July 03, 2025 | 539.00 |
| June 27, 2025 | 547.00 |
| June 20, 2025 | 554.00 |
| June 13, 2025 | 555.00 |
News
Basic Info
|
US Rig Count is at a current level of 558.00, up from 551.00 last week and down from 576.00 one year ago. This is a change of 1.27% from last week and -3.12% from one year ago. |
|
US Rig Count, displays the number of active drilling rigs throughout the United States. The indicator is closely watched as a precursor to oil production in the US oil and gas production industry. Throughout the mid 2010s, US rig counts reached a low of 404 active drilling rigs in May 2016 following significant decreases in oil prices from previous years, then started to rebound as oil prices started to rise again and improvements in drilling technology made previously uneconomical oil deposits viable. |
| Report | Baker Hughes North American Rotary Rig Count |
| Category | Energy |
| Region | United States |
| Source | Baker Hughes |
Stats
| Last Value | 558.00 |
| Latest Period | May 22 2026 |
| Last Updated | May 22 2026, 13:03 EDT |
| Next Release | May 29 2026, 13:00 EDT |
| Average Growth Rate | -0.38% |
| Value from Last Week | 551.00 |
| Change from Last Week | 1.27% |
| Value from 1 Year Ago | 576.00 |
| Change from 1 Year Ago | -3.12% |
| Frequency | Weekly |
| Adjustment | N/A |
| Download Source File |
Related Indicators
| US Energy |
| Brent WTI Spread | 4.48 USD/bbl |
| Henry Hub Natural Gas Spot Price | 3.07 USD/MMBtu |
| Mont Belvieu Propane Spot Price | 0.843 USD/gal |
| US Crude Oil Imports | 6.016M bbl/d |
| US Crude Oil Production | 381.52M bbl |
| US Crude Oil Stocks WoW | -7.863M bbl |
| US Gulf Coast Kerosene-Type Jet Fuel Spot Price | 4.191 USD/gal |
| US Oil Consumption | 19.00M bbl/d |
| US Oil Rig Count | 425.00 |
| US Residential Propane Price | 2.674 USD/gal |
| US Retail Diesel Price | 5.596 USD/gal |
| US Retail Gas Price | 4.621 USD/gal |
| WTI Crude Oil Spot Price | 112.25 USD/bbl |