

US Retail Sales MoM (I:USRSG)
Level Chart
Basic Info
|
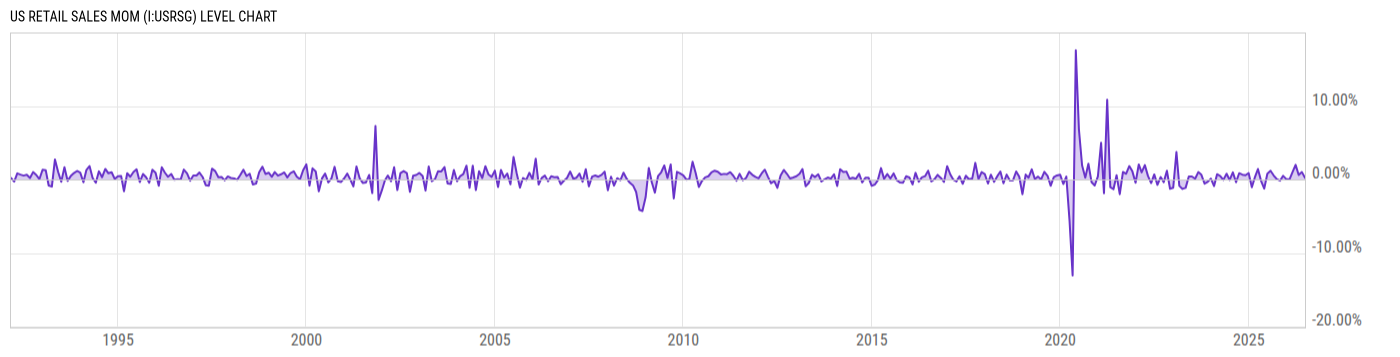
US Retail Sales MoM is at 0.24%, compared to 1.00% last month and 0.78% last year. This is lower than the long term average of 0.38%. |
|
US Retail Sales MoM measures the month over month percent change in total retail sales within the US economy, excluding food and services, and represents a majority of discretionary consumer spending. Historically, US Retail Sales MoM significantly increased in October 2001 compared to the previous month, reaching a high of 7.29% as a result of attractive zero percent financing options for new cars. |
| Region | United States |
| Source | Census Bureau |
Stats
| Last Value | 0.24% |
| Latest Period | Jun 2026 |
| Last Updated | Jul 16 2026, 08:32 EDT |
| Next Release | Aug 14 2026, 08:30 EDT |
| Long Term Average | 0.38% |
| Average Growth Rate | 1.94K% |
| Value from Last Month | 1.00% |
| Change from Last Month | -75.77% |
| Value from 1 Year Ago | 0.78% |
| Change from 1 Year Ago | -68.96% |
| Frequency | Monthly |
| Unit | Percent |
| Adjustment | Seasonally Adjusted |
| Notes | Retail sales exclude food services. From the Advance Monthly Sales for Retail and Food Services. Seasonally adjusted. Not adjusted for inflation. |
Historical Data
| Date | Value |
|---|---|
| June 30, 2026 | 0.24% |
| May 31, 2026 | 1.00% |
| April 30, 2026 | 0.62% |
| March 31, 2026 | 1.99% |
| February 28, 2026 | 0.96% |
| January 31, 2026 | 0.02% |
| December 31, 2025 | 0.06% |
| November 30, 2025 | 0.50% |
| October 31, 2025 | -0.17% |
| September 30, 2025 | 0.04% |
| August 31, 2025 | 0.54% |
| July 31, 2025 | 1.19% |
| June 30, 2025 | 0.78% |
| May 31, 2025 | -1.24% |
| April 30, 2025 | -0.18% |
| March 31, 2025 | 1.42% |
| February 28, 2025 | 0.24% |
| January 31, 2025 | -1.06% |
| December 31, 2024 | 0.87% |
| November 30, 2024 | 0.58% |
| October 31, 2024 | 0.66% |
| September 30, 2024 | 0.86% |
| August 31, 2024 | -0.37% |
| July 31, 2024 | 0.97% |
| June 30, 2024 | -0.07% |
| Date | Value |
|---|---|
| May 31, 2024 | 0.79% |
| April 30, 2024 | -0.05% |
| March 31, 2024 | 0.47% |
| February 29, 2024 | 0.72% |
| January 31, 2024 | -0.89% |
| December 31, 2023 | 0.12% |
| November 30, 2023 | -0.33% |
| October 31, 2023 | -0.57% |
| September 30, 2023 | 0.63% |
| August 31, 2023 | 1.01% |
| July 31, 2023 | 0.10% |
| June 30, 2023 | 0.41% |
| May 31, 2023 | 0.41% |
| April 30, 2023 | -1.14% |
| March 31, 2023 | -1.28% |
| February 28, 2023 | -0.87% |
| January 31, 2023 | 3.74% |
| December 31, 2022 | -1.12% |
| November 30, 2022 | -1.26% |
| October 31, 2022 | 1.18% |
| September 30, 2022 | -0.35% |
| August 31, 2022 | 0.33% |
| July 31, 2022 | -0.73% |
| June 30, 2022 | 0.69% |
| May 31, 2022 | -0.48% |
News
Basic Info
|
US Retail Sales MoM is at 0.24%, compared to 1.00% last month and 0.78% last year. This is lower than the long term average of 0.38%. |
|
US Retail Sales MoM measures the month over month percent change in total retail sales within the US economy, excluding food and services, and represents a majority of discretionary consumer spending. Historically, US Retail Sales MoM significantly increased in October 2001 compared to the previous month, reaching a high of 7.29% as a result of attractive zero percent financing options for new cars. |
| Region | United States |
| Source | Census Bureau |
Stats
| Last Value | 0.24% |
| Latest Period | Jun 2026 |
| Last Updated | Jul 16 2026, 08:32 EDT |
| Next Release | Aug 14 2026, 08:30 EDT |
| Long Term Average | 0.38% |
| Average Growth Rate | 1.94K% |
| Value from Last Month | 1.00% |
| Change from Last Month | -75.77% |
| Value from 1 Year Ago | 0.78% |
| Change from 1 Year Ago | -68.96% |
| Frequency | Monthly |
| Unit | Percent |
| Adjustment | Seasonally Adjusted |
| Notes | Retail sales exclude food services. From the Advance Monthly Sales for Retail and Food Services. Seasonally adjusted. Not adjusted for inflation. |
Related Indicators
| US Retail |