

US Primary Energy Consumption (I:USPEC)
7.307Q Btu for Apr 2026
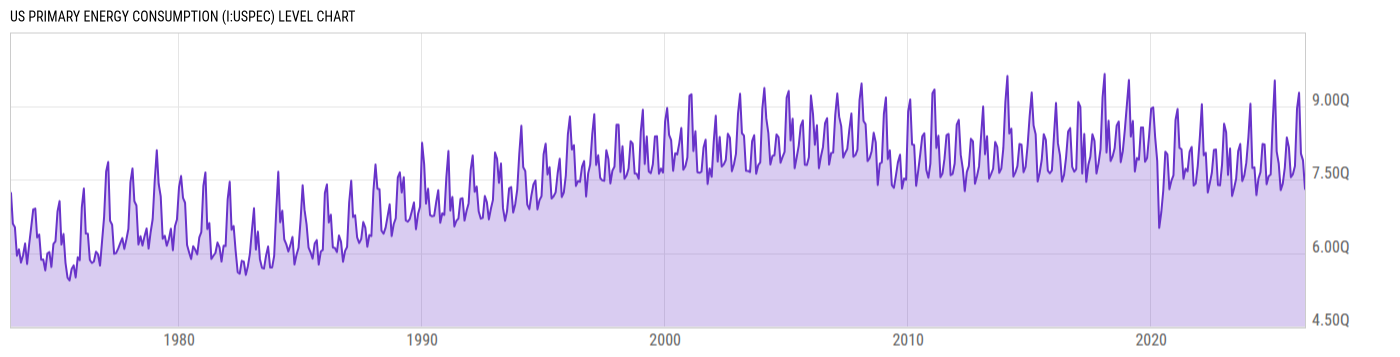
Level Chart
Basic Info
|
US Primary Energy Consumption is at a current level of 7.307Q, down from 7.890Q last month and up from 7.284Q one year ago. This is a change of -7.39% from last month and 0.31% from one year ago. |
| Report | Monthly Energy Review |
| Category | Energy |
| Region | United States |
| Source | Energy Information Administration |
Stats
| Last Value | 7.307Q |
| Latest Period | Apr 2026 |
| Last Updated | Jul 28 2026, 14:07 EDT |
| Next Release | Aug 26 2026, 14:00 EDT |
| Average Growth Rate | 2.79% |
| Value from Last Month | 7.890Q |
| Change from Last Month | -7.39% |
| Value from 1 Year Ago | 7.284Q |
| Change from 1 Year Ago | 0.31% |
| Frequency | Monthly |
| Unit | British thermal units |
| Adjustment | N/A |
| Download Source File |
Historical Data
| Date | Value |
|---|---|
| April 30, 2026 | 7.307Q |
| March 31, 2026 | 7.890Q |
| February 28, 2026 | 8.029Q |
| January 31, 2026 | 9.272Q |
| December 31, 2025 | 8.946Q |
| November 30, 2025 | 7.774Q |
| October 31, 2025 | 7.611Q |
| September 30, 2025 | 7.548Q |
| August 31, 2025 | 8.156Q |
| July 31, 2025 | 8.359Q |
| June 30, 2025 | 7.738Q |
| May 31, 2025 | 7.416Q |
| April 30, 2025 | 7.284Q |
| March 31, 2025 | 7.827Q |
| February 28, 2025 | 8.074Q |
| January 31, 2025 | 9.522Q |
| December 31, 2024 | 8.683Q |
| November 30, 2024 | 7.603Q |
| October 31, 2024 | 7.568Q |
| September 30, 2024 | 7.402Q |
| August 31, 2024 | 8.215Q |
| July 31, 2024 | 8.224Q |
| June 30, 2024 | 7.651Q |
| May 31, 2024 | 7.522Q |
| April 30, 2024 | 7.182Q |
| Date | Value |
|---|---|
| March 31, 2024 | 7.748Q |
| February 29, 2024 | 7.733Q |
| January 31, 2024 | 9.046Q |
| December 31, 2023 | 8.354Q |
| November 30, 2023 | 7.843Q |
| October 31, 2023 | 7.584Q |
| September 30, 2023 | 7.468Q |
| August 31, 2023 | 8.223Q |
| July 31, 2023 | 8.082Q |
| June 30, 2023 | 7.514Q |
| May 31, 2023 | 7.326Q |
| April 30, 2023 | 7.164Q |
| March 31, 2023 | 8.132Q |
| February 28, 2023 | 7.595Q |
| January 31, 2023 | 8.466Q |
| December 31, 2022 | 8.640Q |
| November 30, 2022 | 7.802Q |
| October 31, 2022 | 7.381Q |
| September 30, 2022 | 7.388Q |
| August 31, 2022 | 8.112Q |
| July 31, 2022 | 8.105Q |
| June 30, 2022 | 7.637Q |
| May 31, 2022 | 7.427Q |
| April 30, 2022 | 7.235Q |
| March 31, 2022 | 8.044Q |
News
Headline
Time (ET)
07/27 15:36
07/21 15:56
07/20 15:58
07/02 15:54
Basic Info
|
US Primary Energy Consumption is at a current level of 7.307Q, down from 7.890Q last month and up from 7.284Q one year ago. This is a change of -7.39% from last month and 0.31% from one year ago. |
| Report | Monthly Energy Review |
| Category | Energy |
| Region | United States |
| Source | Energy Information Administration |
Stats
| Last Value | 7.307Q |
| Latest Period | Apr 2026 |
| Last Updated | Jul 28 2026, 14:07 EDT |
| Next Release | Aug 26 2026, 14:00 EDT |
| Average Growth Rate | 2.79% |
| Value from Last Month | 7.890Q |
| Change from Last Month | -7.39% |
| Value from 1 Year Ago | 7.284Q |
| Change from 1 Year Ago | 0.31% |
| Frequency | Monthly |
| Unit | British thermal units |
| Adjustment | N/A |
| Download Source File |