

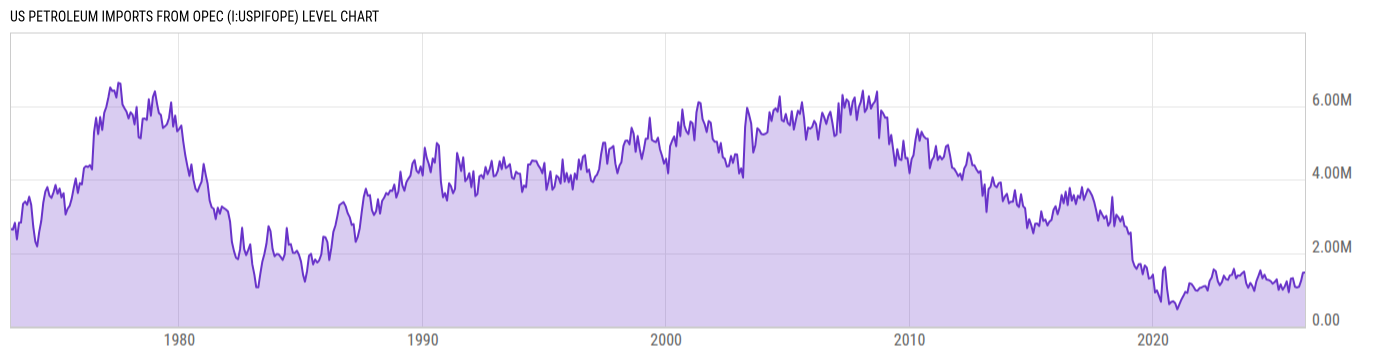
US Petroleum Imports From OPEC (I:USPIFOPE)
1.467M bbl/d for Mar 2026
Level Chart
Basic Info
|
US Petroleum Imports From OPEC is at a current level of 1.467M, up from 1.460M last month and up from 1.146M one year ago. This is a change of 0.42% from last month and 28.00% from one year ago. |
| Report | Monthly Energy Review |
| Category | Energy |
| Region | United States |
| Source | Energy Information Administration |
Stats
| Last Value | 1.467M |
| Latest Period | Mar 2026 |
| Last Updated | Jun 25 2026, 14:13 EDT |
| Next Release | Jul 28 2026, 14:00 EDT |
| Average Growth Rate | 5.65% |
| Value from Last Month | 1.460M |
| Change from Last Month | 0.42% |
| Value from 1 Year Ago | 1.146M |
| Change from 1 Year Ago | 28.00% |
| Frequency | Monthly |
| Unit | Barrels per Day |
| Adjustment | N/A |
| Download Source File |
Historical Data
| Date | Value |
|---|---|
| March 31, 2026 | 1.467M |
| February 28, 2026 | 1.460M |
| January 31, 2026 | 1.239M |
| December 31, 2025 | 1.080M |
| November 30, 2025 | 1.060M |
| October 31, 2025 | 1.080M |
| September 30, 2025 | 1.316M |
| August 31, 2025 | 1.302M |
| July 31, 2025 | 933.32K |
| June 30, 2025 | 1.229M |
| May 31, 2025 | 1.091M |
| April 30, 2025 | 1.000M |
| March 31, 2025 | 1.146M |
| February 28, 2025 | 997.46K |
| January 31, 2025 | 1.282M |
| December 31, 2024 | 1.209M |
| November 30, 2024 | 1.163M |
| October 31, 2024 | 1.238M |
| September 30, 2024 | 1.266M |
| August 31, 2024 | 1.276M |
| July 31, 2024 | 1.409M |
| June 30, 2024 | 1.310M |
| May 31, 2024 | 1.527M |
| April 30, 2024 | 1.368M |
| March 31, 2024 | 1.228M |
| Date | Value |
|---|---|
| February 29, 2024 | 967.55K |
| January 31, 2024 | 1.102M |
| December 31, 2023 | 1.186M |
| November 30, 2023 | 1.053M |
| October 31, 2023 | 1.174M |
| September 30, 2023 | 1.493M |
| August 31, 2023 | 1.45M |
| July 31, 2023 | 1.383M |
| June 30, 2023 | 1.391M |
| May 31, 2023 | 1.311M |
| April 30, 2023 | 1.569M |
| March 31, 2023 | 1.404M |
| February 28, 2023 | 1.391M |
| January 31, 2023 | 1.267M |
| December 31, 2022 | 1.290M |
| November 30, 2022 | 1.384M |
| October 31, 2022 | 1.206M |
| September 30, 2022 | 1.123M |
| August 31, 2022 | 1.233M |
| July 31, 2022 | 1.503M |
| June 30, 2022 | 1.554M |
| May 31, 2022 | 1.334M |
| April 30, 2022 | 1.238M |
| March 31, 2022 | 977.87K |
| February 28, 2022 | 1.099M |
News
Headline
Time (ET)
Basic Info
|
US Petroleum Imports From OPEC is at a current level of 1.467M, up from 1.460M last month and up from 1.146M one year ago. This is a change of 0.42% from last month and 28.00% from one year ago. |
| Report | Monthly Energy Review |
| Category | Energy |
| Region | United States |
| Source | Energy Information Administration |
Stats
| Last Value | 1.467M |
| Latest Period | Mar 2026 |
| Last Updated | Jun 25 2026, 14:13 EDT |
| Next Release | Jul 28 2026, 14:00 EDT |
| Average Growth Rate | 5.65% |
| Value from Last Month | 1.460M |
| Change from Last Month | 0.42% |
| Value from 1 Year Ago | 1.146M |
| Change from 1 Year Ago | 28.00% |
| Frequency | Monthly |
| Unit | Barrels per Day |
| Adjustment | N/A |
| Download Source File |