

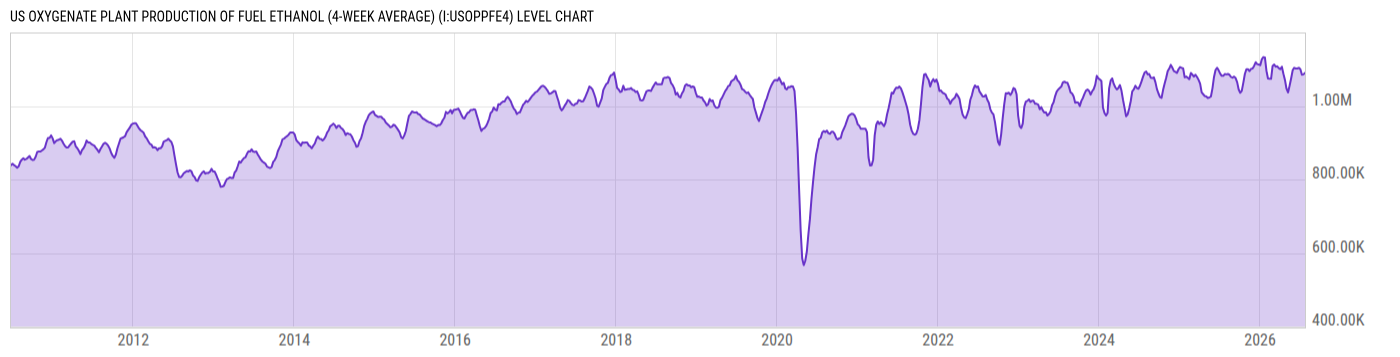
US Oxygenate Plant Production of Fuel Ethanol (4-Week Average) (I:USOPPFE4)
1.09M bbl/d for Wk of Jul 24 2026
Level Chart
Basic Info
|
US Oxygenate Plant Production of Fuel Ethanol (4-Week Average) is at a current level of 1.09M, up from 1.086M last week and up from 1.082M one year ago. This is a change of 0.37% from last week and 0.74% from one year ago. |
| Report | Weekly Petroleum Status |
| Category | Energy |
| Region | United States |
| Source | Energy Information Administration |
Stats
| Last Value | 1.09M |
| Latest Period | Jul 24 2026 |
| Last Updated | Jul 29 2026, 16:34 EDT |
| Next Release | Aug 5 2026, 12:00 EDT |
| Average Growth Rate | 2.27% |
| Value from Last Week | 1.086M |
| Change from Last Week | 0.37% |
| Value from 1 Year Ago | 1.082M |
| Change from 1 Year Ago | 0.74% |
| Frequency | Weekly |
| Unit | Barrels per Day |
| Adjustment | N/A |
| Download Source File |
Historical Data
| Date | Value |
|---|---|
| July 24, 2026 | 1.09M |
| July 17, 2026 | 1.086M |
| July 10, 2026 | 1.085M |
| July 03, 2026 | 1.10M |
| June 26, 2026 | 1.104M |
| June 19, 2026 | 1.102M |
| June 12, 2026 | 1.102M |
| June 05, 2026 | 1.104M |
| May 29, 2026 | 1.097M |
| May 22, 2026 | 1.075M |
| May 15, 2026 | 1.055M |
| May 08, 2026 | 1.037M |
| May 01, 2026 | 1.047M |
| April 24, 2026 | 1.071M |
| April 17, 2026 | 1.088M |
| April 10, 2026 | 1.107M |
| April 03, 2026 | 1.10M |
| March 27, 2026 | 1.103M |
| March 20, 2026 | 1.108M |
| March 13, 2026 | 1.107M |
| March 06, 2026 | 1.113M |
| February 27, 2026 | 1.109M |
| February 20, 2026 | 1.074M |
| February 13, 2026 | 1.074M |
| February 06, 2026 | 1.075M |
| Date | Value |
|---|---|
| January 30, 2026 | 1.096M |
| January 23, 2026 | 1.132M |
| January 16, 2026 | 1.133M |
| January 09, 2026 | 1.127M |
| January 02, 2026 | 1.111M |
| December 26, 2025 | 1.113M |
| December 19, 2025 | 1.114M |
| December 12, 2025 | 1.119M |
| December 05, 2025 | 1.109M |
| November 28, 2025 | 1.102M |
| November 21, 2025 | 1.101M |
| November 14, 2025 | 1.095M |
| November 07, 2025 | 1.10M |
| October 31, 2025 | 1.10M |
| October 24, 2025 | 1.087M |
| October 17, 2025 | 1.063M |
| October 10, 2025 | 1.041M |
| October 03, 2025 | 1.036M |
| September 26, 2025 | 1.045M |
| September 19, 2025 | 1.065M |
| September 12, 2025 | 1.076M |
| September 05, 2025 | 1.08M |
| August 29, 2025 | 1.077M |
| August 22, 2025 | 1.079M |
| August 15, 2025 | 1.085M |
News
Headline
Time (ET)
07/31 15:54
07/22 14:54
07/21 15:56
07/20 15:58
07/17 15:55
Basic Info
|
US Oxygenate Plant Production of Fuel Ethanol (4-Week Average) is at a current level of 1.09M, up from 1.086M last week and up from 1.082M one year ago. This is a change of 0.37% from last week and 0.74% from one year ago. |
| Report | Weekly Petroleum Status |
| Category | Energy |
| Region | United States |
| Source | Energy Information Administration |
Stats
| Last Value | 1.09M |
| Latest Period | Jul 24 2026 |
| Last Updated | Jul 29 2026, 16:34 EDT |
| Next Release | Aug 5 2026, 12:00 EDT |
| Average Growth Rate | 2.27% |
| Value from Last Week | 1.086M |
| Change from Last Week | 0.37% |
| Value from 1 Year Ago | 1.082M |
| Change from 1 Year Ago | 0.74% |
| Frequency | Weekly |
| Unit | Barrels per Day |
| Adjustment | N/A |
| Download Source File |