

US Household Formation (I:USHF)
1.373M for Jun 2026
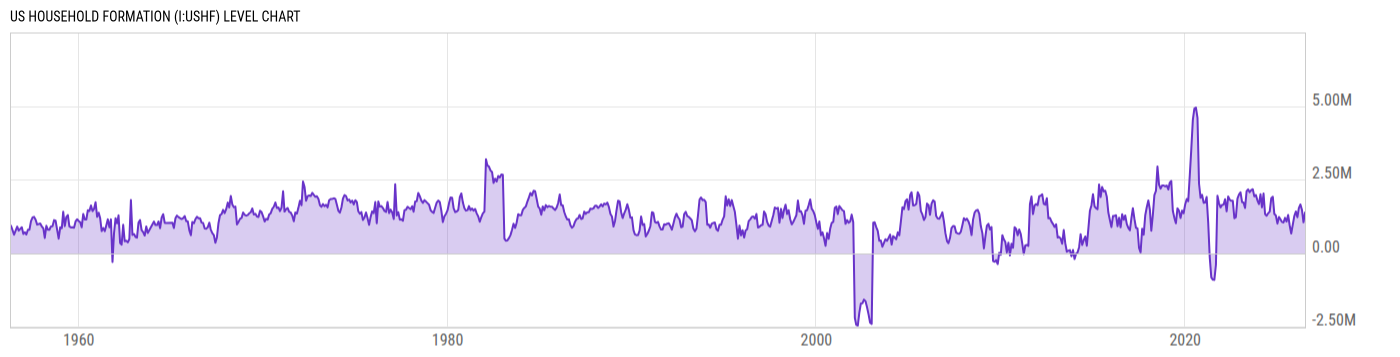
Level Chart
Basic Info
|
US Household Formation is at a current level of 1.373M, up from 1.044M last month and up from 1.07M one year ago. This is a change of 31.51% from last month and 28.32% from one year ago. |
| Report | Housing Vacancies and Homeownership |
| Category | House Sales |
| Region | United States |
| Source | Census Bureau |
Stats
| Last Value | 1.373M |
| Latest Period | Jun 2026 |
| Last Updated | Jul 28 2026, 10:03 EDT |
| Next Release | Oct 28 2026, 10:00 EDT |
| Average Growth Rate | 55.20% |
| Value from Last Month | 1.044M |
| Change from Last Month | 31.51% |
| Value from 1 Year Ago | 1.07M |
| Change from 1 Year Ago | 28.32% |
| Frequency | Monthly |
| Adjustment | Not Seasonally Adjusted |
| Download Source File | |
| Notes | Year over Year change in monthly household estimates by the Census Bureau. |
Historical Data
| Date | Value |
|---|---|
| June 30, 2026 | 1.373M |
| May 31, 2026 | 1.044M |
| April 30, 2026 | 1.473M |
| March 31, 2026 | 1.651M |
| February 28, 2026 | 1.528M |
| January 31, 2026 | 1.217M |
| December 31, 2025 | 1.41M |
| November 30, 2025 | 1.255M |
| September 30, 2025 | 664.00K |
| August 31, 2025 | 936.00K |
| July 31, 2025 | 1.295M |
| June 30, 2025 | 1.07M |
| May 31, 2025 | 1.194M |
| April 30, 2025 | 1.038M |
| March 31, 2025 | 1.058M |
| February 28, 2025 | 1.146M |
| January 31, 2025 | 1.226M |
| December 31, 2024 | 999.00K |
| November 30, 2024 | 1.273M |
| October 31, 2024 | 1.325M |
| September 30, 2024 | 1.915M |
| August 31, 2024 | 1.863M |
| July 31, 2024 | 1.407M |
| June 30, 2024 | 1.349M |
| May 31, 2024 | 1.266M |
| Date | Value |
|---|---|
| April 30, 2024 | 1.325M |
| March 31, 2024 | 2.024M |
| February 29, 2024 | 1.555M |
| January 31, 2024 | 1.998M |
| December 31, 2023 | 1.665M |
| November 30, 2023 | 1.791M |
| October 31, 2023 | 1.972M |
| September 30, 2023 | 1.926M |
| August 31, 2023 | 2.17M |
| July 31, 2023 | 2.14M |
| June 30, 2023 | 2.068M |
| May 31, 2023 | 2.163M |
| April 30, 2023 | 2.101M |
| March 31, 2023 | 1.532M |
| February 28, 2023 | 1.717M |
| January 31, 2023 | 1.729M |
| December 31, 2022 | 2.063M |
| November 30, 2022 | 1.984M |
| October 31, 2022 | 1.85M |
| September 30, 2022 | 1.222M |
| August 31, 2022 | 1.184M |
| July 31, 2022 | 1.773M |
| June 30, 2022 | 1.773M |
| May 31, 2022 | 1.81M |
| April 30, 2022 | 1.922M |
News
Headline
Time (ET)
07/16 08:37
Basic Info
|
US Household Formation is at a current level of 1.373M, up from 1.044M last month and up from 1.07M one year ago. This is a change of 31.51% from last month and 28.32% from one year ago. |
| Report | Housing Vacancies and Homeownership |
| Category | House Sales |
| Region | United States |
| Source | Census Bureau |
Stats
| Last Value | 1.373M |
| Latest Period | Jun 2026 |
| Last Updated | Jul 28 2026, 10:03 EDT |
| Next Release | Oct 28 2026, 10:00 EDT |
| Average Growth Rate | 55.20% |
| Value from Last Month | 1.044M |
| Change from Last Month | 31.51% |
| Value from 1 Year Ago | 1.07M |
| Change from 1 Year Ago | 28.32% |
| Frequency | Monthly |
| Adjustment | Not Seasonally Adjusted |
| Download Source File | |
| Notes | Year over Year change in monthly household estimates by the Census Bureau. |