

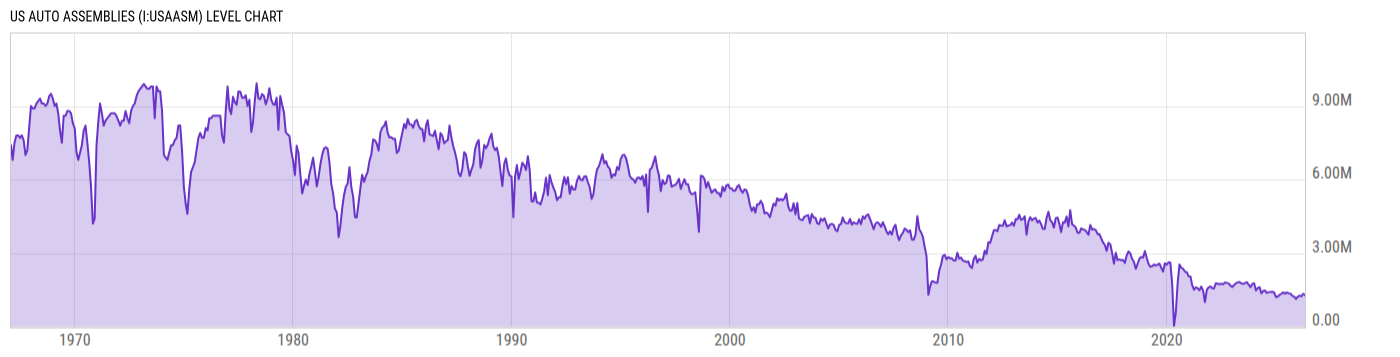
US Auto Assemblies (I:USAASM)
1.273M for Apr 2026
Level Chart
Basic Info
|
US Auto Assemblies is at a current level of 1.273M, down from 1.338M last month and down from 1.394M one year ago. This is a change of -4.81% from last month and -8.65% from one year ago. |
| Report | G.17 Industrial Production and Capacity Utilization |
| Category | Manufacturing Business Statistics |
| Region | United States |
| Source | Federal Reserve |
Stats
| Last Value | 1.273M |
| Latest Period | Apr 2026 |
| Last Updated | May 15 2026, 09:19 EDT |
| Next Release | Jun 15 2026, 09:15 EDT |
| Average Growth Rate | 49.03% |
| Value from Last Month | 1.338M |
| Change from Last Month | -4.81% |
| Value from 1 Year Ago | 1.394M |
| Change from 1 Year Ago | -8.65% |
| Frequency | Monthly |
| Adjustment | Seasonally Adjusted |
| Download Source File |
Historical Data
| Date | Value |
|---|---|
| April 30, 2026 | 1.273M |
| March 31, 2026 | 1.338M |
| February 28, 2026 | 1.226M |
| January 31, 2026 | 1.261M |
| December 31, 2025 | 1.221M |
| November 30, 2025 | 1.126M |
| October 31, 2025 | 1.22M |
| September 30, 2025 | 1.249M |
| August 31, 2025 | 1.342M |
| July 31, 2025 | 1.350M |
| June 30, 2025 | 1.392M |
| May 31, 2025 | 1.342M |
| April 30, 2025 | 1.394M |
| March 31, 2025 | 1.336M |
| February 28, 2025 | 1.288M |
| January 31, 2025 | 1.224M |
| December 31, 2024 | 1.203M |
| November 30, 2024 | 1.389M |
| October 31, 2024 | 1.418M |
| September 30, 2024 | 1.412M |
| August 31, 2024 | 1.403M |
| July 31, 2024 | 1.369M |
| June 30, 2024 | 1.468M |
| May 31, 2024 | 1.446M |
| April 30, 2024 | 1.357M |
| Date | Value |
|---|---|
| March 31, 2024 | 1.612M |
| February 29, 2024 | 1.567M |
| January 31, 2024 | 1.468M |
| December 31, 2023 | 1.768M |
| November 30, 2023 | 1.739M |
| October 31, 2023 | 1.604M |
| September 30, 2023 | 1.713M |
| August 31, 2023 | 1.808M |
| July 31, 2023 | 1.772M |
| June 30, 2023 | 1.737M |
| May 31, 2023 | 1.759M |
| April 30, 2023 | 1.814M |
| March 31, 2023 | 1.798M |
| February 28, 2023 | 1.757M |
| January 31, 2023 | 1.697M |
| December 31, 2022 | 1.613M |
| November 30, 2022 | 1.666M |
| October 31, 2022 | 1.761M |
| September 30, 2022 | 1.780M |
| August 31, 2022 | 1.796M |
| July 31, 2022 | 1.728M |
| June 30, 2022 | 1.742M |
| May 31, 2022 | 1.724M |
| April 30, 2022 | 1.746M |
| March 31, 2022 | 1.767M |
News
Headline
Time (ET)
06/01 11:11
05/13 17:00
05/13 15:57
Basic Info
|
US Auto Assemblies is at a current level of 1.273M, down from 1.338M last month and down from 1.394M one year ago. This is a change of -4.81% from last month and -8.65% from one year ago. |
| Report | G.17 Industrial Production and Capacity Utilization |
| Category | Manufacturing Business Statistics |
| Region | United States |
| Source | Federal Reserve |
Stats
| Last Value | 1.273M |
| Latest Period | Apr 2026 |
| Last Updated | May 15 2026, 09:19 EDT |
| Next Release | Jun 15 2026, 09:15 EDT |
| Average Growth Rate | 49.03% |
| Value from Last Month | 1.338M |
| Change from Last Month | -4.81% |
| Value from 1 Year Ago | 1.394M |
| Change from 1 Year Ago | -8.65% |
| Frequency | Monthly |
| Adjustment | Seasonally Adjusted |
| Download Source File |