

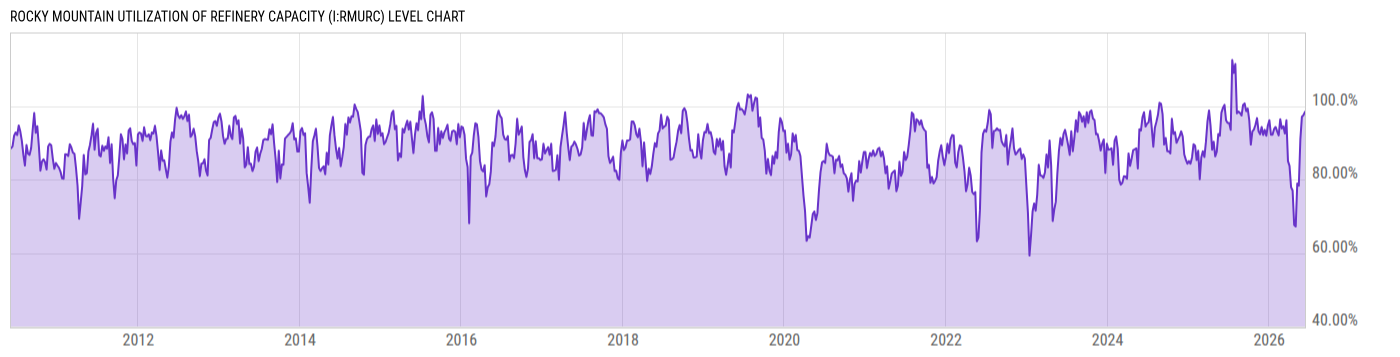
Rocky Mountain Utilization of Refinery Capacity (I:RMURC)
98.40% for Wk of Jun 12 2026
Level Chart
Basic Info
|
Rocky Mountain Utilization of Refinery Capacity is at 98.40%, compared to 97.50% last week and 99.50% last year. This is higher than the long term average of 89.03%. |
| Report | Weekly Petroleum Status |
| Category | Energy |
| Region | N/A |
| Source | Energy Information Administration |
Stats
| Last Value | 98.40% |
| Latest Period | Jun 12 2026 |
| Last Updated | Jun 17 2026, 13:13 EDT |
| Next Release | Jun 24 2026, 12:00 EDT |
| Long Term Average | 89.03% |
| Average Growth Rate | 6.27% |
| Value from Last Week | 97.50% |
| Change from Last Week | 0.92% |
| Value from 1 Year Ago | 99.50% |
| Change from 1 Year Ago | -1.11% |
| Frequency | Weekly |
| Unit | Percent of Capacity |
| Adjustment | N/A |
| Download Source File | |
| Notes | Percentage of operable capacity that is utilized. Petroleum Administration for Defense District: PADD 4 |
Historical Data
| Date | Value |
|---|---|
| June 12, 2026 | 98.40% |
| June 05, 2026 | 97.50% |
| May 29, 2026 | 97.10% |
| May 22, 2026 | 90.90% |
| May 15, 2026 | 78.30% |
| May 08, 2026 | 78.90% |
| May 01, 2026 | 67.20% |
| April 24, 2026 | 67.60% |
| April 17, 2026 | 77.00% |
| April 10, 2026 | 77.90% |
| April 03, 2026 | 83.70% |
| March 27, 2026 | 85.00% |
| March 20, 2026 | 96.10% |
| March 13, 2026 | 92.50% |
| March 06, 2026 | 94.50% |
| February 27, 2026 | 93.90% |
| February 20, 2026 | 96.40% |
| February 13, 2026 | 92.00% |
| February 06, 2026 | 93.10% |
| January 30, 2026 | 94.30% |
| January 23, 2026 | 93.70% |
| January 16, 2026 | 92.20% |
| January 09, 2026 | 92.20% |
| January 02, 2026 | 96.10% |
| December 26, 2025 | 94.70% |
| Date | Value |
|---|---|
| December 19, 2025 | 91.90% |
| December 12, 2025 | 93.50% |
| December 05, 2025 | 92.10% |
| November 28, 2025 | 94.30% |
| November 21, 2025 | 92.30% |
| November 14, 2025 | 93.10% |
| November 07, 2025 | 96.70% |
| October 31, 2025 | 94.90% |
| October 24, 2025 | 93.60% |
| October 17, 2025 | 93.10% |
| October 10, 2025 | 89.50% |
| October 03, 2025 | 96.10% |
| September 26, 2025 | 99.30% |
| September 19, 2025 | 98.60% |
| September 12, 2025 | 100.7% |
| September 05, 2025 | 100.3% |
| August 29, 2025 | 97.40% |
| August 22, 2025 | 98.10% |
| August 15, 2025 | 98.50% |
| August 08, 2025 | 98.00% |
| August 01, 2025 | 111.4% |
| July 25, 2025 | 109.0% |
| July 18, 2025 | 112.5% |
| July 11, 2025 | 93.50% |
| July 04, 2025 | 95.40% |
News
Headline
Time (ET)
06/10 14:38
06/10 08:46
06/01 14:42
05/27 06:13
05/21 14:40
Basic Info
|
Rocky Mountain Utilization of Refinery Capacity is at 98.40%, compared to 97.50% last week and 99.50% last year. This is higher than the long term average of 89.03%. |
| Report | Weekly Petroleum Status |
| Category | Energy |
| Region | N/A |
| Source | Energy Information Administration |
Stats
| Last Value | 98.40% |
| Latest Period | Jun 12 2026 |
| Last Updated | Jun 17 2026, 13:13 EDT |
| Next Release | Jun 24 2026, 12:00 EDT |
| Long Term Average | 89.03% |
| Average Growth Rate | 6.27% |
| Value from Last Week | 97.50% |
| Change from Last Week | 0.92% |
| Value from 1 Year Ago | 99.50% |
| Change from 1 Year Ago | -1.11% |
| Frequency | Weekly |
| Unit | Percent of Capacity |
| Adjustment | N/A |
| Download Source File | |
| Notes | Percentage of operable capacity that is utilized. Petroleum Administration for Defense District: PADD 4 |