

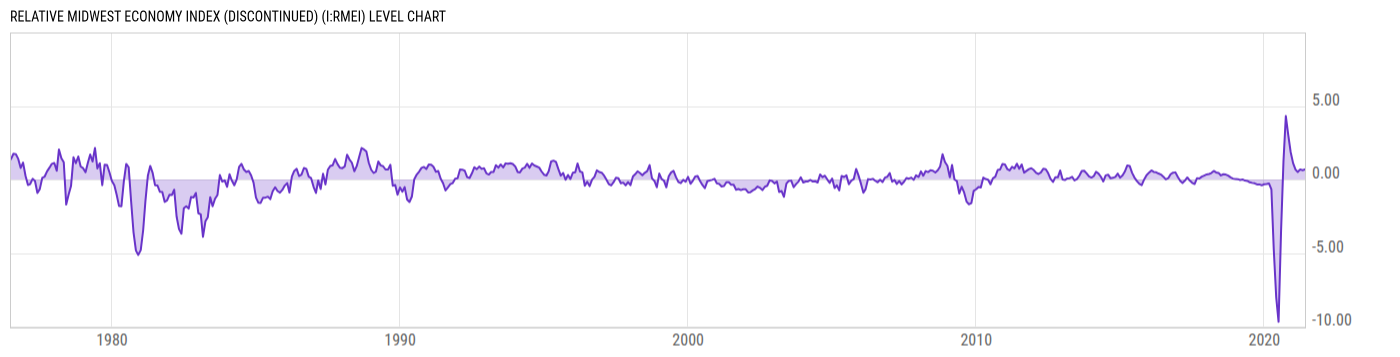
Relative Midwest Economy Index (DISCONTINUED) (I:RMEI)
0.6874 for May 2021
Level Chart
Basic Info
|
Relative Midwest Economy Index is at a current level of 0.6874, up from 0.6302 last month and up from -8.012 one year ago. This is a change of 9.08% from last month. |
| Report | Midwest Economy Index |
| Category | Economic Sentiment, Outlook and Activity |
| Region | N/A |
| Source | Federal Reserve Bank of Chicago |
Stats
| Last Value | 0.6874 |
| Latest Period | May 2021 |
| Last Updated | Jun 30 2021, 08:39 EDT |
| Average Growth Rate | 1.26K% |
| Value from Last Month | 0.6302 |
| Change from Last Month | 9.08% |
| Value from 1 Year Ago | -8.012 |
| Change from 1 Year Ago | N/A |
| Frequency | Monthly |
| Adjustment | N/A |
| Download Source File |
Historical Data
| Date | Value |
|---|---|
| May 31, 2021 | 0.6874 |
| April 30, 2021 | 0.6302 |
| March 31, 2021 | 0.6853 |
| February 28, 2021 | 0.514 |
| January 31, 2021 | 0.6731 |
| December 31, 2020 | 1.112 |
| November 30, 2020 | 1.876 |
| October 31, 2020 | 3.024 |
| September 30, 2020 | 4.313 |
| August 31, 2020 | 1.224 |
| July 31, 2020 | -3.610 |
| June 30, 2020 | -9.683 |
| May 31, 2020 | -8.012 |
| April 30, 2020 | -4.758 |
| March 31, 2020 | -0.6749 |
| February 29, 2020 | -0.2673 |
| January 31, 2020 | -0.3065 |
| December 31, 2019 | -0.3219 |
| November 30, 2019 | -0.3991 |
| October 31, 2019 | -0.3328 |
| September 30, 2019 | -0.3372 |
| August 31, 2019 | -0.2613 |
| July 31, 2019 | -0.2287 |
| June 30, 2019 | -0.1888 |
| May 31, 2019 | -0.098 |
| Date | Value |
|---|---|
| April 30, 2019 | -0.0755 |
| March 31, 2019 | 0.0059 |
| February 28, 2019 | -0.031 |
| January 31, 2019 | 0.0218 |
| December 31, 2018 | 0.0259 |
| November 30, 2018 | 0.0605 |
| October 31, 2018 | 0.145 |
| September 30, 2018 | 0.2613 |
| August 31, 2018 | 0.3366 |
| July 31, 2018 | 0.3569 |
| June 30, 2018 | 0.2746 |
| May 31, 2018 | 0.4468 |
| April 30, 2018 | 0.4816 |
| March 31, 2018 | 0.5839 |
| February 28, 2018 | 0.4377 |
| January 31, 2018 | 0.3729 |
| December 31, 2017 | 0.3454 |
| November 30, 2017 | 0.2697 |
| October 31, 2017 | 0.1962 |
| September 30, 2017 | 0.0654 |
| August 31, 2017 | 0.0928 |
| July 31, 2017 | -0.3076 |
| June 30, 2017 | -0.2237 |
| May 31, 2017 | -0.0724 |
| April 30, 2017 | 0.1382 |
News
Headline
Time (ET)
06/17 16:30
06/10 16:11
06/03 17:00
06/03 13:50
05/22 07:43
Basic Info
|
Relative Midwest Economy Index is at a current level of 0.6874, up from 0.6302 last month and up from -8.012 one year ago. This is a change of 9.08% from last month. |
| Report | Midwest Economy Index |
| Category | Economic Sentiment, Outlook and Activity |
| Region | N/A |
| Source | Federal Reserve Bank of Chicago |
Stats
| Last Value | 0.6874 |
| Latest Period | May 2021 |
| Last Updated | Jun 30 2021, 08:39 EDT |
| Average Growth Rate | 1.26K% |
| Value from Last Month | 0.6302 |
| Change from Last Month | 9.08% |
| Value from 1 Year Ago | -8.012 |
| Change from 1 Year Ago | N/A |
| Frequency | Monthly |
| Adjustment | N/A |
| Download Source File |