

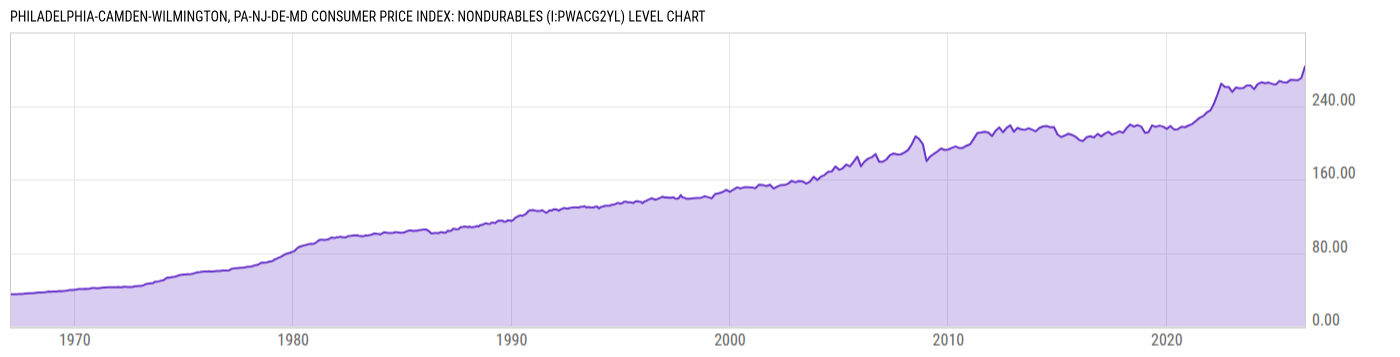
Philadelphia-Camden-Wilmington, PA-NJ-DE-MD Consumer Price Index: Nondurables (I:PWACG2YL)
282.99 for Apr 2026
Level Chart
Basic Info
|
Philadelphia-Camden-Wilmington, PA-NJ-DE-MD Consumer Price Index: Nondurables is at a current level of 282.99, up from 270.47 two months ago and up from 265.96 one year ago. This is a change of 4.63% from two months ago and 6.40% from one year ago. |
| Report | Consumer Price Index |
| Category | Consumer Prices |
| Region | N/A |
| Source | Bureau of Labor Statistics |
Stats
| Last Value | 282.99 |
| Latest Period | Apr 2026 |
| Last Updated | May 15 2026, 18:20 EDT |
| Next Release | Jul 14 2026, 08:30 EDT |
| Average Growth Rate | 2.37% |
| Value from Two Months Ago | 270.47 |
| Change from Two Months Ago | 4.63% |
| Value from 1 Year Ago | 265.96 |
| Change from 1 Year Ago | 6.40% |
| Frequency | Bimonthly |
| Unit | Index 1982-84=100 |
| Adjustment | Not Seasonally Adjusted |
| Download Source File |
Historical Data
| Date | Value |
|---|---|
| April 30, 2026 | 282.99 |
| February 28, 2026 | 270.47 |
| December 31, 2025 | 268.02 |
| August 31, 2025 | 268.45 |
| June 30, 2025 | 265.45 |
| April 30, 2025 | 265.96 |
| February 28, 2025 | 267.19 |
| December 31, 2024 | 263.51 |
| October 31, 2024 | 264.07 |
| August 31, 2024 | 265.48 |
| June 30, 2024 | 264.85 |
| April 30, 2024 | 265.77 |
| February 29, 2024 | 263.72 |
| December 31, 2023 | 258.32 |
| October 31, 2023 | 262.44 |
| August 31, 2023 | 262.28 |
| June 30, 2023 | 259.46 |
| April 30, 2023 | 259.30 |
| February 28, 2023 | 260.03 |
| December 31, 2022 | 255.27 |
| October 31, 2022 | 260.80 |
| August 31, 2022 | 260.58 |
| June 30, 2022 | 264.35 |
| April 30, 2022 | 253.08 |
| February 28, 2022 | 242.69 |
| Date | Value |
|---|---|
| December 31, 2021 | 235.20 |
| October 31, 2021 | 232.96 |
| August 31, 2021 | 228.94 |
| June 30, 2021 | 227.08 |
| April 30, 2021 | 223.60 |
| February 28, 2021 | 220.32 |
| December 31, 2020 | 218.80 |
| October 31, 2020 | 216.89 |
| August 31, 2020 | 217.38 |
| June 30, 2020 | 214.64 |
| April 30, 2020 | 214.56 |
| February 29, 2020 | 218.14 |
| December 31, 2019 | 215.15 |
| October 31, 2019 | 217.57 |
| August 31, 2019 | 218.65 |
| June 30, 2019 | 217.25 |
| April 30, 2019 | 218.90 |
| February 28, 2019 | 211.52 |
| December 31, 2018 | 210.79 |
| October 31, 2018 | 217.58 |
| August 31, 2018 | 219.24 |
| June 30, 2018 | 217.66 |
| April 30, 2018 | 219.80 |
| February 28, 2018 | 216.01 |
| December 31, 2017 | 210.95 |
News
Headline
Time (ET)
06/26 14:18
06/22 09:15
Basic Info
|
Philadelphia-Camden-Wilmington, PA-NJ-DE-MD Consumer Price Index: Nondurables is at a current level of 282.99, up from 270.47 two months ago and up from 265.96 one year ago. This is a change of 4.63% from two months ago and 6.40% from one year ago. |
| Report | Consumer Price Index |
| Category | Consumer Prices |
| Region | N/A |
| Source | Bureau of Labor Statistics |
Stats
| Last Value | 282.99 |
| Latest Period | Apr 2026 |
| Last Updated | May 15 2026, 18:20 EDT |
| Next Release | Jul 14 2026, 08:30 EDT |
| Average Growth Rate | 2.37% |
| Value from Two Months Ago | 270.47 |
| Change from Two Months Ago | 4.63% |
| Value from 1 Year Ago | 265.96 |
| Change from 1 Year Ago | 6.40% |
| Frequency | Bimonthly |
| Unit | Index 1982-84=100 |
| Adjustment | Not Seasonally Adjusted |
| Download Source File |