

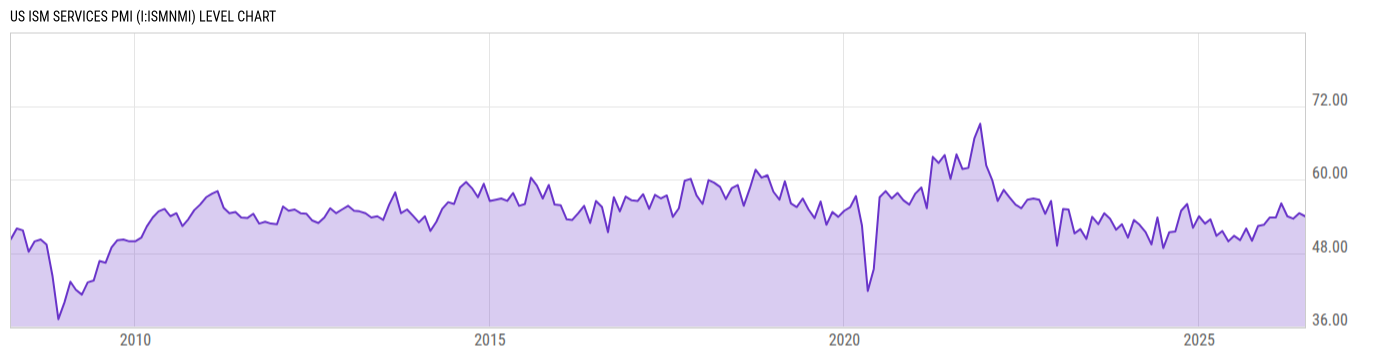
US ISM Services PMI (I:ISMNMI)
54.00 for Jun 2026
Level Chart
Basic Info
|
US ISM Services PMI is at a current level of 54.00, N/A from last month and up from 50.80 one year ago. This is a change of N/A from last month and 6.30% from one year ago. |
| Region | United States |
| Source | Institute for Supply Management |
Stats
| Last Value | 54.00 |
| Latest Period | Jun 2026 |
| Last Updated | Jul 6 2026, 10:05 EDT |
| Next Release | Aug 5 2026, 10:00 EDT |
| Average Growth Rate | 1.74% |
| Value from Last Month | |
| Change from Last Month | N/A |
| Value from 1 Year Ago | 50.80 |
| Change from 1 Year Ago | 6.30% |
| Frequency | Monthly |
| Adjustment | Seasonally Adjusted |
| Download Source File |
Historical Data
| Date | Value |
|---|---|
| June 30, 2026 | 54.00 |
| May 31, 2026 | 54.50 |
| April 30, 2026 | 53.60 |
| March 31, 2026 | 54.00 |
| February 28, 2026 | 56.10 |
| January 31, 2026 | 53.80 |
| December 31, 2025 | 53.80 |
| November 30, 2025 | 52.60 |
| October 31, 2025 | 52.40 |
| September 30, 2025 | 50.00 |
| August 31, 2025 | 52.00 |
| July 31, 2025 | 50.10 |
| June 30, 2025 | 50.80 |
| May 31, 2025 | 49.90 |
| April 30, 2025 | 51.60 |
| March 31, 2025 | 50.80 |
| February 28, 2025 | 53.50 |
| January 31, 2025 | 52.80 |
| December 31, 2024 | 54.00 |
| November 30, 2024 | 52.10 |
| October 31, 2024 | 56.00 |
| September 30, 2024 | 54.90 |
| August 31, 2024 | 51.50 |
| July 31, 2024 | 51.40 |
| June 30, 2024 | 48.80 |
| Date | Value |
|---|---|
| May 31, 2024 | 53.80 |
| April 30, 2024 | 49.40 |
| March 31, 2024 | 51.40 |
| February 29, 2024 | 52.60 |
| January 31, 2024 | 53.40 |
| December 31, 2023 | 50.50 |
| November 30, 2023 | 52.70 |
| October 31, 2023 | 51.80 |
| September 30, 2023 | 53.60 |
| August 31, 2023 | 54.50 |
| July 31, 2023 | 52.70 |
| June 30, 2023 | 53.90 |
| May 31, 2023 | 50.30 |
| April 30, 2023 | 51.90 |
| March 31, 2023 | 51.20 |
| February 28, 2023 | 55.10 |
| January 31, 2023 | 55.20 |
| December 31, 2022 | 49.20 |
| November 30, 2022 | 56.50 |
| October 31, 2022 | 54.40 |
| September 30, 2022 | 56.70 |
| August 31, 2022 | 56.90 |
| July 31, 2022 | 56.70 |
| June 30, 2022 | 55.30 |
| May 31, 2022 | 55.90 |
News
Headline
Time (ET)
07/24 13:30
07/23 08:53
BoC Survey Signals Shift Toward Productivity-Boosting Investment as Hiring Intentions Fall, BMO Says
07/07 06:26
07/01 17:04
Basic Info
|
US ISM Services PMI is at a current level of 54.00, N/A from last month and up from 50.80 one year ago. This is a change of N/A from last month and 6.30% from one year ago. |
| Region | United States |
| Source | Institute for Supply Management |
Stats
| Last Value | 54.00 |
| Latest Period | Jun 2026 |
| Last Updated | Jul 6 2026, 10:05 EDT |
| Next Release | Aug 5 2026, 10:00 EDT |
| Average Growth Rate | 1.74% |
| Value from Last Month | |
| Change from Last Month | N/A |
| Value from 1 Year Ago | 50.80 |
| Change from 1 Year Ago | 6.30% |
| Frequency | Monthly |
| Adjustment | Seasonally Adjusted |
| Download Source File |