

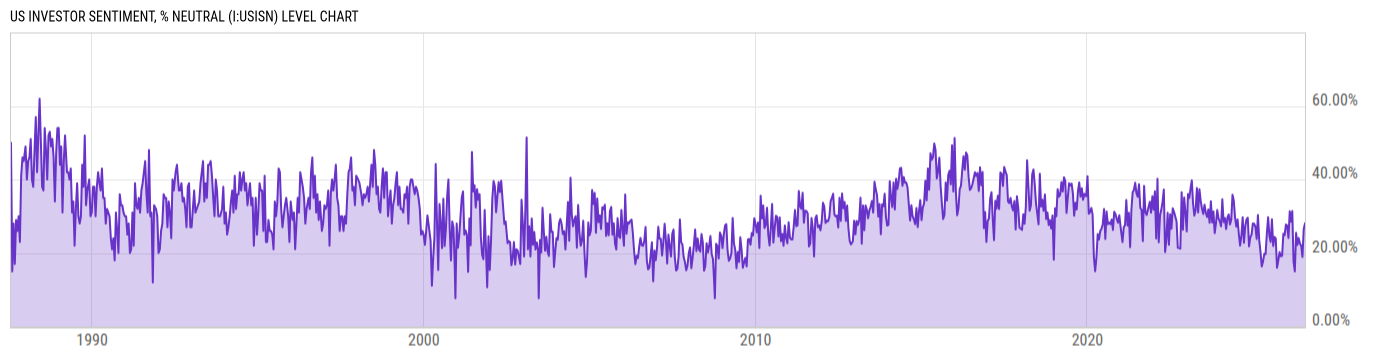
US Investor Sentiment, % Neutral (I:USISN)
28.06% for Wk of Jul 23 2026
Level Chart
Basic Info
|
US Investor Sentiment, % Neutral is at 28.06%, compared to 22.22% last week and 21.75% last year. This is lower than the long term average of 31.01%. |
| Report | AAII Sentiment Survey |
| Category | Market Indices and Statistics |
Stats
| Last Value | 28.06% |
| Latest Period | Jul 23 2026 |
| Last Updated | Jul 24 2026, 08:15 EDT |
| Next Release | Jul 30 2026, 12:00 EDT |
| Long Term Average | 31.01% |
| Average Growth Rate | 120.1% |
| Value from Last Week | 22.22% |
| Change from Last Week | 26.28% |
| Value from 1 Year Ago | 21.75% |
| Change from 1 Year Ago | 29.01% |
| Frequency | Weekly |
| Unit | Percent |
| Adjustment | N/A |
| Download Source File |
Historical Data
| Date | Value |
|---|---|
| July 23, 2026 | 28.06% |
| July 16, 2026 | 22.22% |
| July 09, 2026 | 26.51% |
| July 02, 2026 | 26.36% |
| June 25, 2026 | 18.94% |
| June 18, 2026 | 24.07% |
| June 11, 2026 | 21.96% |
| June 04, 2026 | 26.74% |
| May 28, 2026 | 22.59% |
| May 21, 2026 | 24.67% |
| May 14, 2026 | 24.07% |
| May 07, 2026 | 28.74% |
| April 30, 2026 | 22.18% |
| April 23, 2026 | 19.53% |
| April 16, 2026 | 25.48% |
| April 09, 2026 | 21.27% |
| April 02, 2026 | 15.00% |
| March 26, 2026 | 18.11% |
| March 19, 2026 | 17.60% |
| March 12, 2026 | 21.67% |
| March 05, 2026 | 31.40% |
| February 26, 2026 | 27.05% |
| February 19, 2026 | 28.51% |
| February 12, 2026 | 23.35% |
| February 05, 2026 | 31.33% |
| Date | Value |
|---|---|
| January 29, 2026 | 24.80% |
| January 22, 2026 | 24.10% |
| January 15, 2026 | 22.26% |
| January 08, 2026 | 27.48% |
| January 01, 2026 | 30.97% |
| December 25, 2025 | 27.75% |
| December 18, 2025 | 22.66% |
| December 11, 2025 | 24.84% |
| December 04, 2025 | 24.91% |
| November 27, 2025 | 25.27% |
| November 20, 2025 | 23.86% |
| November 13, 2025 | 19.24% |
| November 06, 2025 | 25.76% |
| October 30, 2025 | 19.11% |
| October 23, 2025 | 20.48% |
| October 16, 2025 | 20.26% |
| October 09, 2025 | 18.48% |
| October 02, 2025 | 17.92% |
| September 25, 2025 | 19.06% |
| September 18, 2025 | 15.97% |
| September 11, 2025 | 22.49% |
| September 04, 2025 | 23.95% |
| August 28, 2025 | 25.95% |
| August 21, 2025 | 24.35% |
| August 14, 2025 | 23.96% |
News
Headline
Time (ET)
07/27 08:52
Basic Info
|
US Investor Sentiment, % Neutral is at 28.06%, compared to 22.22% last week and 21.75% last year. This is lower than the long term average of 31.01%. |
| Report | AAII Sentiment Survey |
| Category | Market Indices and Statistics |
Stats
| Last Value | 28.06% |
| Latest Period | Jul 23 2026 |
| Last Updated | Jul 24 2026, 08:15 EDT |
| Next Release | Jul 30 2026, 12:00 EDT |
| Long Term Average | 31.01% |
| Average Growth Rate | 120.1% |
| Value from Last Week | 22.22% |
| Change from Last Week | 26.28% |
| Value from 1 Year Ago | 21.75% |
| Change from 1 Year Ago | 29.01% |
| Frequency | Weekly |
| Unit | Percent |
| Adjustment | N/A |
| Download Source File |