

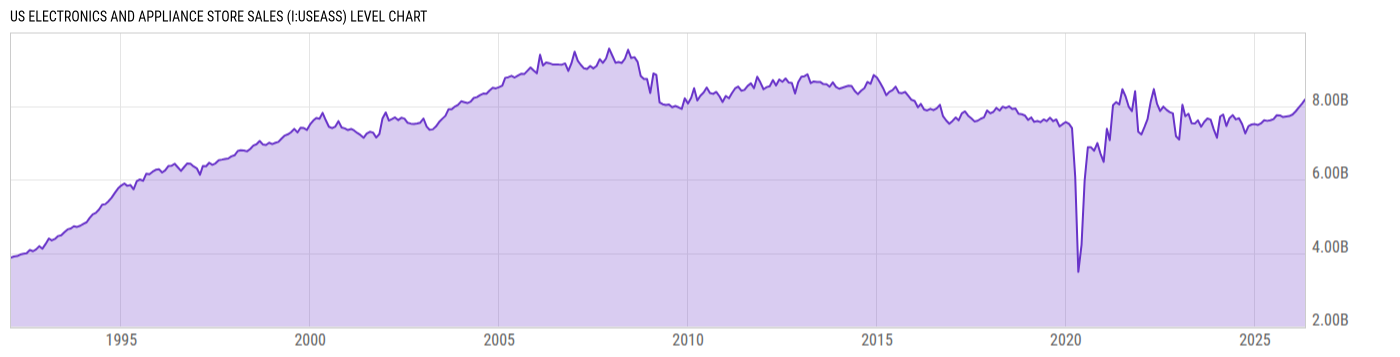
US Electronics and Appliance Store Sales (I:USEASS)
8.174B USD for Apr 2026
Level Chart
Basic Info
|
US Electronics and Appliance Store Sales is at a current level of 8.174B, up from 8.058B last month and up from 7.595B one year ago. This is a change of 1.44% from last month and 7.62% from one year ago. |
| Region | United States |
| Source | Census Bureau |
Stats
| Last Value | 8.174B |
| Latest Period | Apr 2026 |
| Last Updated | May 14 2026, 08:35 EDT |
| Next Release | Jun 17 2026, 08:30 EDT |
| Average Growth Rate | 3.20% |
| Value from Last Month | 8.058B |
| Change from Last Month | 1.44% |
| Value from 1 Year Ago | 7.595B |
| Change from 1 Year Ago | 7.62% |
| Frequency | Monthly |
| Unit | USD |
| Adjustment | Seasonally Adjusted |
| Notes | From the Advance Monthly Sales for Retail and Food Services. Seasonally adjusted. Not adjusted for inflation. |
Historical Data
| Date | Value |
|---|---|
| April 30, 2026 | 8.174B |
| March 31, 2026 | 8.058B |
| February 28, 2026 | 7.953B |
| January 31, 2026 | 7.857B |
| December 31, 2025 | 7.768B |
| November 30, 2025 | 7.727B |
| October 31, 2025 | 7.717B |
| September 30, 2025 | 7.698B |
| August 31, 2025 | 7.742B |
| July 31, 2025 | 7.748B |
| June 30, 2025 | 7.644B |
| May 31, 2025 | 7.612B |
| April 30, 2025 | 7.595B |
| March 31, 2025 | 7.61B |
| February 28, 2025 | 7.526B |
| January 31, 2025 | 7.484B |
| December 31, 2024 | 7.507B |
| November 30, 2024 | 7.497B |
| October 31, 2024 | 7.455B |
| September 30, 2024 | 7.253B |
| August 31, 2024 | 7.504B |
| July 31, 2024 | 7.666B |
| June 30, 2024 | 7.636B |
| May 31, 2024 | 7.752B |
| April 30, 2024 | 7.667B |
| Date | Value |
|---|---|
| March 31, 2024 | 7.455B |
| February 29, 2024 | 7.769B |
| January 31, 2024 | 7.714B |
| December 31, 2023 | 7.136B |
| November 30, 2023 | 7.365B |
| October 31, 2023 | 7.629B |
| September 30, 2023 | 7.661B |
| August 31, 2023 | 7.571B |
| July 31, 2023 | 7.436B |
| June 30, 2023 | 7.61B |
| May 31, 2023 | 7.521B |
| April 30, 2023 | 7.533B |
| March 31, 2023 | 7.788B |
| February 28, 2023 | 7.723B |
| January 31, 2023 | 8.032B |
| December 31, 2022 | 7.087B |
| November 30, 2022 | 7.176B |
| October 31, 2022 | 7.80B |
| September 30, 2022 | 7.835B |
| August 31, 2022 | 7.895B |
| July 31, 2022 | 7.984B |
| June 30, 2022 | 7.864B |
| May 31, 2022 | 8.056B |
| April 30, 2022 | 8.459B |
| March 31, 2022 | 8.125B |
News
Headline
Time (ET)
05/25 08:54
05/22 09:40
05/22 08:46
05/22 07:28
Basic Info
|
US Electronics and Appliance Store Sales is at a current level of 8.174B, up from 8.058B last month and up from 7.595B one year ago. This is a change of 1.44% from last month and 7.62% from one year ago. |
| Region | United States |
| Source | Census Bureau |
Stats
| Last Value | 8.174B |
| Latest Period | Apr 2026 |
| Last Updated | May 14 2026, 08:35 EDT |
| Next Release | Jun 17 2026, 08:30 EDT |
| Average Growth Rate | 3.20% |
| Value from Last Month | 8.058B |
| Change from Last Month | 1.44% |
| Value from 1 Year Ago | 7.595B |
| Change from 1 Year Ago | 7.62% |
| Frequency | Monthly |
| Unit | USD |
| Adjustment | Seasonally Adjusted |
| Notes | From the Advance Monthly Sales for Retail and Food Services. Seasonally adjusted. Not adjusted for inflation. |