

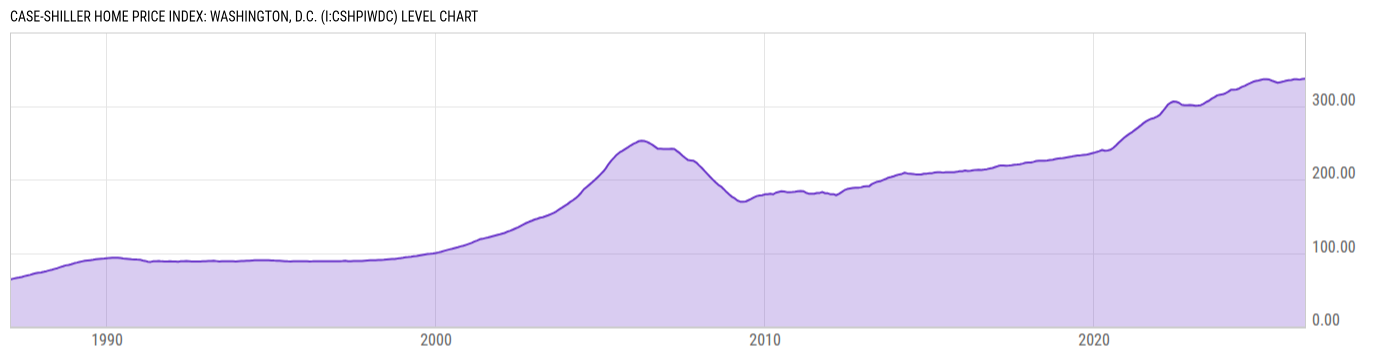
Case-Shiller Home Price Index: Washington, D.C. (I:CSHPIWDC)
336.97 for May 2026
Level Chart
Basic Info
|
Case-Shiller Home Price Index: Washington, D.C. is at a current level of 336.97, up from 336.64 last month and up from 334.33 one year ago. This is a change of 0.10% from last month and 0.79% from one year ago. |
| Report | Case-Shiller Home Price Index |
| Category | House Prices |
| Region | N/A |
| Source | Standard and Poor's |
Stats
| Last Value | 336.97 |
| Latest Period | May 2026 |
| Last Updated | Jul 28 2026, 12:35 EDT |
| Next Release | Aug 25 2026, 09:00 EDT |
| Average Growth Rate | 4.25% |
| Value from Last Month | 336.64 |
| Change from Last Month | 0.10% |
| Value from 1 Year Ago | 334.33 |
| Change from 1 Year Ago | 0.79% |
| Frequency | Monthly |
| Unit | Index January 2000=100 |
| Adjustment | Seasonally Adjusted |
| Download Source File |
Historical Data
| Date | Value |
|---|---|
| May 31, 2026 | 336.97 |
| April 30, 2026 | 336.64 |
| March 31, 2026 | 335.89 |
| February 28, 2026 | 336.25 |
| January 31, 2026 | 336.30 |
| December 31, 2025 | 335.37 |
| November 30, 2025 | 334.96 |
| October 31, 2025 | 334.30 |
| September 30, 2025 | 333.21 |
| August 31, 2025 | 332.45 |
| July 31, 2025 | 331.65 |
| June 30, 2025 | 332.98 |
| May 31, 2025 | 334.33 |
| April 30, 2025 | 335.93 |
| March 31, 2025 | 336.43 |
| February 28, 2025 | 336.56 |
| January 31, 2025 | 335.79 |
| December 31, 2024 | 334.79 |
| November 30, 2024 | 333.93 |
| October 31, 2024 | 332.93 |
| September 30, 2024 | 331.05 |
| August 31, 2024 | 329.50 |
| July 31, 2024 | 327.43 |
| June 30, 2024 | 325.98 |
| May 31, 2024 | 323.86 |
| Date | Value |
|---|---|
| April 30, 2024 | 322.38 |
| March 31, 2024 | 322.06 |
| February 29, 2024 | 321.97 |
| January 31, 2024 | 319.56 |
| December 31, 2023 | 317.33 |
| November 30, 2023 | 315.85 |
| October 31, 2023 | 315.32 |
| September 30, 2023 | 314.44 |
| August 31, 2023 | 312.00 |
| July 31, 2023 | 310.02 |
| June 30, 2023 | 307.13 |
| May 31, 2023 | 305.42 |
| April 30, 2023 | 302.88 |
| March 31, 2023 | 301.07 |
| February 28, 2023 | 300.53 |
| January 31, 2023 | 300.41 |
| December 31, 2022 | 301.01 |
| November 30, 2022 | 301.44 |
| October 31, 2022 | 301.11 |
| September 30, 2022 | 300.96 |
| August 31, 2022 | 301.77 |
| July 31, 2022 | 304.45 |
| June 30, 2022 | 305.68 |
| May 31, 2022 | 306.07 |
| April 30, 2022 | 304.48 |
News
Headline
Time (ET)
Basic Info
|
Case-Shiller Home Price Index: Washington, D.C. is at a current level of 336.97, up from 336.64 last month and up from 334.33 one year ago. This is a change of 0.10% from last month and 0.79% from one year ago. |
| Report | Case-Shiller Home Price Index |
| Category | House Prices |
| Region | N/A |
| Source | Standard and Poor's |
Stats
| Last Value | 336.97 |
| Latest Period | May 2026 |
| Last Updated | Jul 28 2026, 12:35 EDT |
| Next Release | Aug 25 2026, 09:00 EDT |
| Average Growth Rate | 4.25% |
| Value from Last Month | 336.64 |
| Change from Last Month | 0.10% |
| Value from 1 Year Ago | 334.33 |
| Change from 1 Year Ago | 0.79% |
| Frequency | Monthly |
| Unit | Index January 2000=100 |
| Adjustment | Seasonally Adjusted |
| Download Source File |