

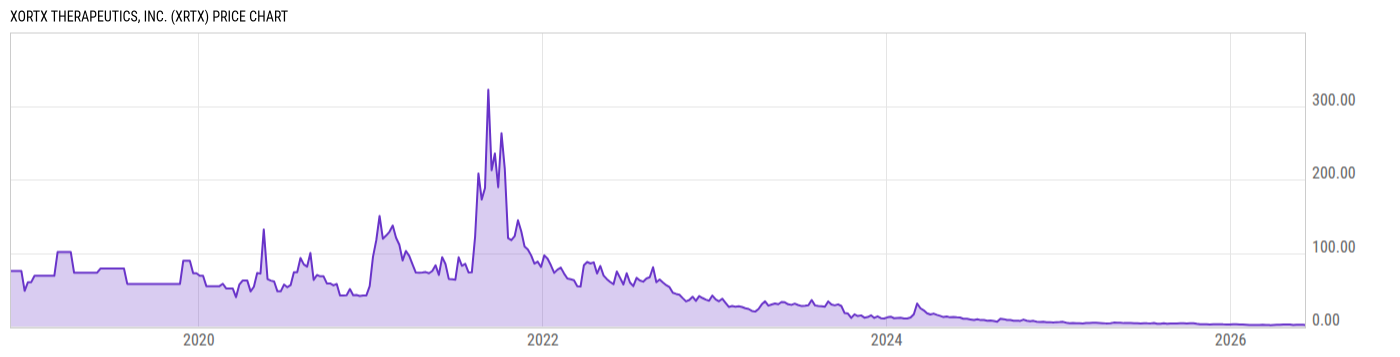
XORTX Therapeutics, Inc. (XRTX)
2.15
-0.06
(-2.71%)
USD |
NASDAQ |
Jun 08, 16:00
2.15
0.00 (0.00%)
After-Hours: 20:00
Price Chart
Key Stats
| Price and Performance | |
|---|---|
| Market Cap | 2.994M |
| 52 Week High (Daily) | |
| 52 Week Low (Daily) | |
| All-Time High (Daily) | |
| Year to Date Total Returns (Daily) | |
| 1 Month Total Returns (Daily) | |
| 1 Year Total Returns (Daily) | -51.69% |
| Valuation | |
| PE Ratio | -- |
| PE Ratio (Forward) | |
| PS Ratio | -- |
| Price to Book Value | 2.332 |
| EV to EBITDA | |
| Dividend | |
|---|---|
| Dividend | -- |
| Dividend Yield (Forward) | |
| Financials | |
| Revenue (5 Year Growth) | |
| Revenue (Quarterly YoY Growth) | |
| EPS Diluted (5 Year Growth) | |
| EPS Diluted (Quarterly YoY Growth) | |
| Debt to Equity Ratio | 0.0118 |
| Return on Equity | |
| Return on Assets | |
| Risk | |
| Beta (5Y) | |
| Max Drawdown (5Y) | 99.46% |
Profile
| XORTX Therapeutics, Inc. is a biopharmaceutical company. The firm engages in development and commercialization of innovative therapies. It focuses on drug therapies for rare orphan disease indications such as polycystic kidney disease, and the treatment of health consequences caused by chronic high serum uric acid or hyperuricemia, including Type 2 Diabetic Nephropathy, cardiovascular disease, and diabetes. The company was founded by Allen Davidoff on May 31, 2011 and is headquartered in Calgary, Canada. |
| URL | http://www.xortx.com |
| Investor Relations URL | N/A |
| HQ State/Province | Alberta |
| Sector | Health Care |
| Industry | Pharmaceuticals |
| Next Earnings Release | N/A |
| Last Earnings Release | Apr. 07, 2014 |
| Next Ex-Dividend Date | N/A |
| Last Ex-Dividend Date | N/A |