

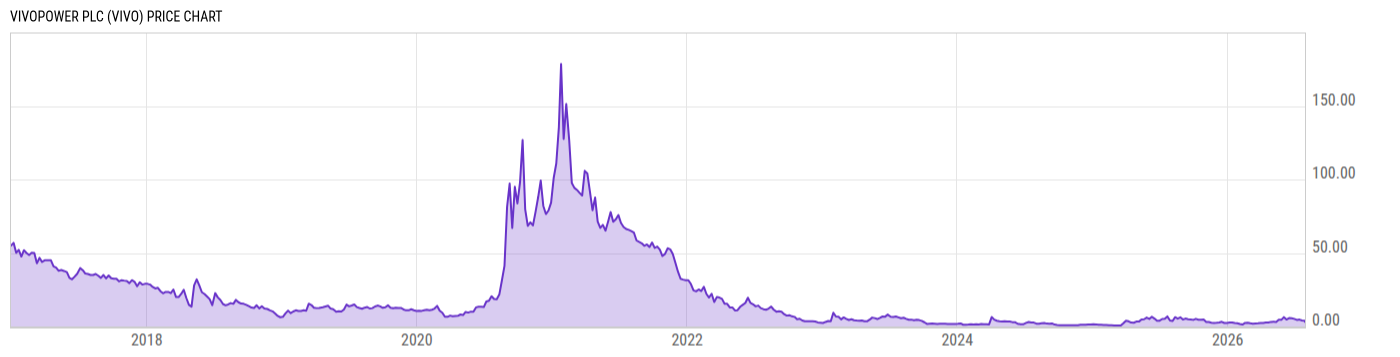
VivoPower Plc (VIVO)
3.17
-0.71
(-18.30%)
USD |
NASDAQ |
Jul 29, 16:00
3.20
+0.03
(+0.95%)
After-Hours: 04:51
Price Chart
Key Stats
| Price and Performance | |
|---|---|
| Market Cap | 39.71M |
| 52 Week High (Daily) | |
| 52 Week Low (Daily) | |
| All-Time High (Daily) | |
| Year to Date Total Returns (Daily) | |
| 1 Month Total Returns (Daily) | |
| 1 Year Total Returns (Daily) | -21.53% |
| Valuation | |
| PE Ratio | -- |
| PE Ratio (Forward) | |
| PS Ratio | -- |
| Price to Book Value | -- |
| EV to EBITDA | |
| Dividend | |
|---|---|
| Dividend | -- |
| Dividend Yield (Forward) | |
| Financials | |
| Revenue (5 Year Growth) | |
| Revenue (Quarterly YoY Growth) | |
| EPS Diluted (5 Year Growth) | |
| EPS Diluted (Quarterly YoY Growth) | |
| Debt to Equity Ratio | -- |
| Return on Equity | |
| Return on Assets | |
| Risk | |
| Beta (5Y) | |
| Max Drawdown (5Y) | 99.64% |
Profile
| VivoPower Plc focuses on developing and operating sustainable data center infrastructure that guarantees sovereign control over power, data, and national intelligence. It helps sovereign nations bridge the gap between their energy assets and their AI ambitions by providing the Power-to-X infrastructure necessary to build and control domestic intelligence hubs. The company operates globally with a presence across the United Kingdom, Australia, North America, Europe, the Middle East, and Southeast Asia. VivoPower was founded in 2014 and is headquartered in London, the United Kingdom. |
| URL | http://www.vivopower.com |
| Investor Relations URL | https://vivopower.com/investors/ |
| HQ State/Province | Greater London |
| Sector | Utilities |
| Industry | Independent Power & Renewable Electricity Producers |
| Equity Style | Small Cap Value |
| Next Earnings Release | N/A |
| Last Earnings Release | Feb. 23, 2023 |
| Next Ex-Dividend Date | N/A |
| Last Ex-Dividend Date | N/A |