

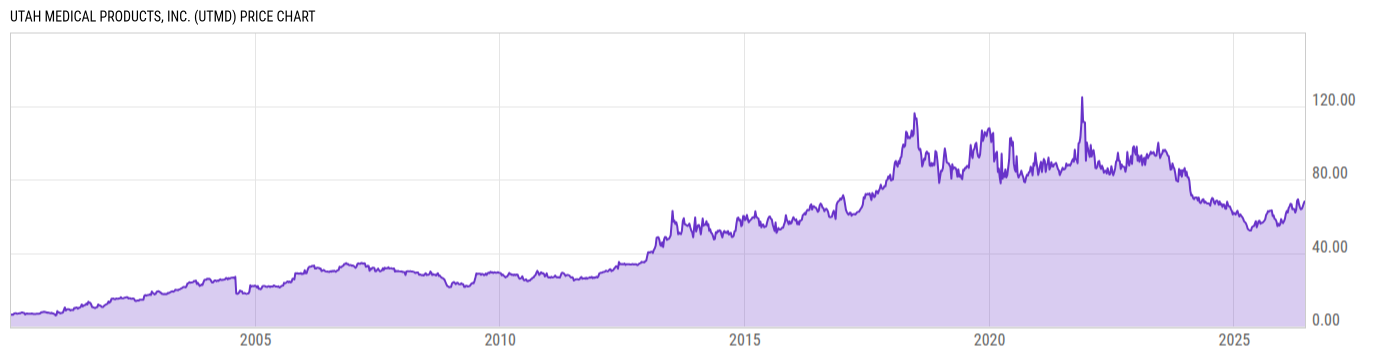
Utah Medical Products, Inc. (UTMD)
67.05
-0.60
(-0.89%)
USD |
NASDAQ |
Jun 08, 16:00
Price Chart
Key Stats
| Price and Performance | |
|---|---|
| Market Cap | 213.49M |
| 52 Week High (Daily) | |
| 52 Week Low (Daily) | |
| All-Time High (Daily) | |
| Year to Date Total Returns (Daily) | |
| 1 Month Total Returns (Daily) | |
| 1 Year Total Returns (Daily) | 21.87% |
| Valuation | |
| PE Ratio | 19.84 |
| PE Ratio (Forward) | |
| PS Ratio | 5.733 |
| Price to Book Value | 1.774 |
| EV to EBITDA | |
| Dividend | |
|---|---|
| Dividend | 0.31 |
| Dividend Yield (Forward) | |
| Financials | |
| Revenue (5 Year Growth) | |
| Revenue (Quarterly YoY Growth) | |
| EPS Diluted (5 Year Growth) | |
| EPS Diluted (Quarterly YoY Growth) | |
| Debt to Equity Ratio | 0.0017 |
| Return on Equity | |
| Return on Assets | |
| Risk | |
| Beta (5Y) | |
| Max Drawdown (5Y) | 55.58% |
Profile
| Utah Medical Products, Inc. engages in the manufacturing, developing, and marketing of disposable and reusable medical devices. It focuses on the healthcare of women and babies. The firm's products are used for blood pressure monitoring and blood collection, electrosurgery, gynecology, neonatal critical care, perinatology, and urology. The company was founded on April 21, 1978 and is headquartered in Midvale, UT. |
| URL | http://www.utahmed.com |
| Investor Relations URL | http://www.utahmed.com/investor-relations.html |
| HQ State/Province | Utah |
| Sector | Health Care |
| Industry | Health Care Equipment & Supplies |
| Next Earnings Release | Jul. 23, 2026 (est.) |
| Last Earnings Release | Apr. 23, 2026 |
| Next Ex-Dividend Date | Jun. 17, 2026 |
| Last Ex-Dividend Date | Mar. 17, 2026 |