

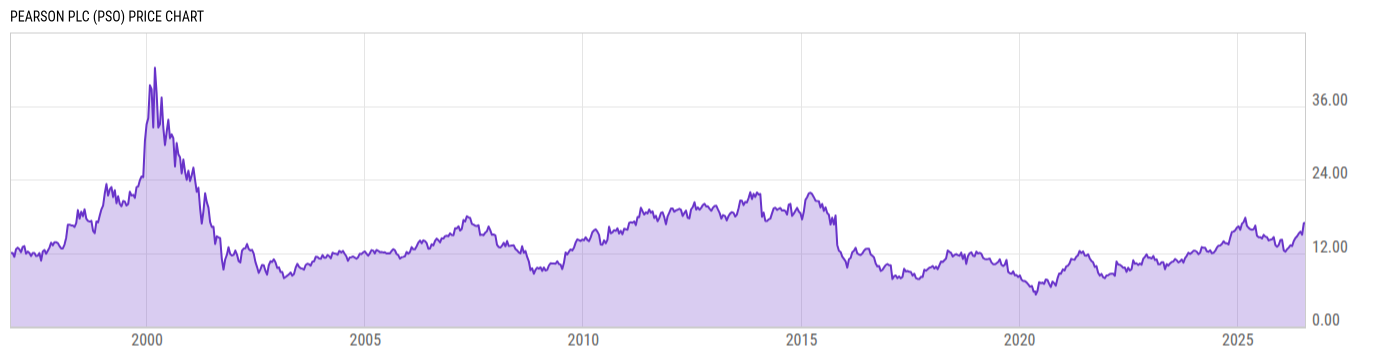
Pearson Plc (PSO)
16.67
-0.25
(-1.48%)
USD |
NYSE |
Jul 20, 10:24
Price Chart
Key Stats
| Price and Performance | |
|---|---|
| Market Cap | 11.06B |
| 52 Week High (Daily) | |
| 52 Week Low (Daily) | |
| All-Time High (Daily) | |
| Year to Date Total Returns (Daily) | |
| 1 Month Total Returns (Daily) | |
| 1 Year Total Returns (Daily) | 21.90% |
| Valuation | |
| PE Ratio | -- |
| PE Ratio (Forward) | |
| PS Ratio | 2.358 |
| Price to Book Value | -- |
| EV to EBITDA | |
| Dividend | |
|---|---|
| Dividend | 0.2346 |
| Dividend Yield (Forward) | |
| Financials | |
| Revenue (5 Year Growth) | |
| Revenue (Quarterly YoY Growth) | |
| EPS Diluted (5 Year Growth) | |
| EPS Diluted (Quarterly YoY Growth) | |
| Debt to Equity Ratio | -- |
| Return on Equity | |
| Return on Assets | |
| Risk | |
| Beta (5Y) | |
| Max Drawdown (5Y) | 36.49% |
Profile
| Pearson Plc engages in the business of education, business information, and consumer publishing markets. It operates through the following segments: Assessment and Qualifications, Virtual Learning, English Language Learning, Enterprise Learning and Skills, and Higher Education. The Assessment and Qualifications segment includes Pearson VUE, US school assessment, clinical assessment, UK GCSE, A levels and international academic qualifications, and associated courseware including the English-speaking Canadian and Australian K-12 businesses, and PDRI. The Virtual Learning segment is involved in virtual schools and online program management. The English Language Learning segment focuses on Pearson test of English, institutional courseware, and English online solutions. The Enterprise Learning and Skills segment offers vocational qualifications, GED, TalentLens, Faethm, Credly, and enterprise content and training. The Higher Education segment provides U.S., Canadian, and international higher education courseware businesses. The company was founded by Pearson Samuel in 1844 and is headquartered in London, the United Kingdom. |
| URL | http://plc.pearson.com |
| Investor Relations URL | https://plc.pearson.com/en-GB/investors |
| HQ State/Province | Greater London |
| Sector | Consumer Discretionary |
| Industry | Diversified Consumer Services |
| Equity Style | Small Cap Value |
| Next Earnings Release | Jul. 31, 2026 |
| Last Earnings Release | Feb. 27, 2026 |
| Next Ex-Dividend Date | N/A |
| Last Ex-Dividend Date | Mar. 20, 2026 |