

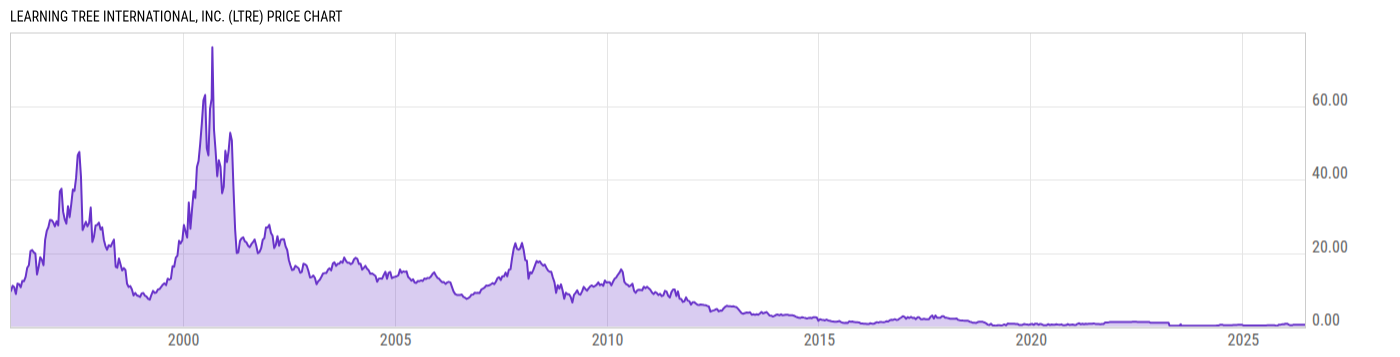
Learning Tree International, Inc. (LTRE)
0.51
0.00 (0.00%)
USD |
OTCM |
Jun 16, 16:00
Price Chart
Key Stats
| Price and Performance | |
|---|---|
| Market Cap | 6.744M |
| 52 Week High (Daily) | |
| 52 Week Low (Daily) | |
| All-Time High (Daily) | |
| Year to Date Total Returns (Daily) | |
| 1 Month Total Returns (Daily) | |
| 1 Year Total Returns (Daily) | 70.00% |
| Valuation | |
| PE Ratio | -- |
| PE Ratio (Forward) | |
| PS Ratio | -- |
| Price to Book Value | -- |
| EV to EBITDA | |
| Dividend | |
|---|---|
| Dividend | -- |
| Dividend Yield (Forward) | |
| Financials | |
| Revenue (5 Year Growth) | |
| Revenue (Quarterly YoY Growth) | |
| EPS Diluted (5 Year Growth) | |
| EPS Diluted (Quarterly YoY Growth) | |
| Debt to Equity Ratio | -- |
| Return on Equity | |
| Return on Assets | |
| Risk | |
| Beta (5Y) | |
| Max Drawdown (5Y) | 88.89% |
Profile
| Learning Tree International, Inc. provides information technology and management training to business and government organizations. The firm offers various courses, including web development, cyber security, program and project management, agile, operating systems, networking, cloud computing, and leadership. It also provides workforce optimization solutions, such as needs assessments, skill gaps analyses, blended learning solutions, and acceleration workshops. The company was founded by Eric R. Garen and David C. Collins in 1974 and is headquartered in Herndon, VA. |
| URL | http://www.learningtree.com |
| Investor Relations URL | https://www5.learningtree.com/investor/ |
| HQ State/Province | Virginia |
| Sector | Consumer Discretionary |
| Industry | Diversified Consumer Services |
| Equity Style | Small Cap Core |
| Next Earnings Release | N/A |
| Last Earnings Release | Feb. 28, 2019 |
| Next Ex-Dividend Date | N/A |
| Last Ex-Dividend Date | Aug. 18, 2010 |