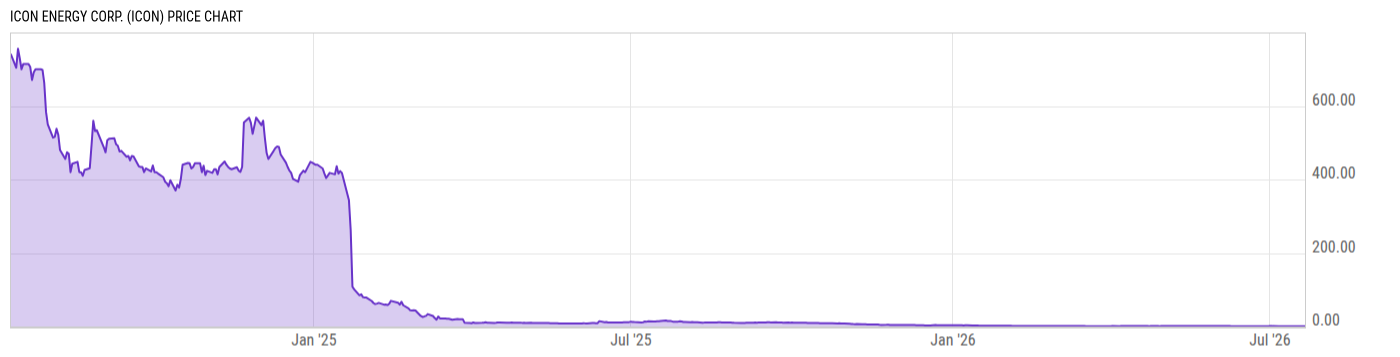
Iconix Brand Group (ICON)
News
| May 17 | Moody's Upgrades Iconix Brand Group's Corporate Family Rating from B1 to Ba3, Outlook... |
| May 16 | BRIEF - Moody's raises Iconix Brands rating to Ba3 |
| May 16 | Here's How Iconix Brand Group Is Making You So Much Cash Fool |
| May 14 | Iconix Brand (ICON) Enters Rule 10b5-1 Trading Plan Street Insider |
| May 14 | Iconix Brand Group Announces 10b5-1 Plan Benzinga |
| May 11 | Bearish MACD for Iconix Brand Group, Inc. |
| May 09 | $ICON ------ http://stks.co/3kwP by MrDowJones |
| May 08 | YALE BOCK: Why I bought Iconix and dispatched DirectTV $DTV $ICON http://stks.co/3iFd by covestor |
| May 07 | $ICON filed latest Quarterly Report http://stks.co/3hts by MarketBrief |
| May 07 | ICONIX BRAND GROUP, INC. Files SEC form 10-Q, Quarterly Report |
| Apr 26 | $ICON after double bottom yesterday it's already narrowing that gap window. not holding but may take a tier 1 position soon. by Good2go |
| Apr 25 | News related to $ICON: 'Iconix 1Q profit falls, cuts outlook, shares drop' http://stks.co/3Vlh by TradeBot |
Profile
Exchange: NASDAQGM Sector: Consumer Goods Industry: Textile - Apparel Footwear & Accessories
Iconix Brand Group, Inc. is a brand management company that licenses brands to retailers and manufacturers primarily in the apparel, footwear, and apparel accessory industries. The company's brands include Candie's, Bongo, Badgley Mischka, Joe Boxer, Rampage, Mudd, London Fog, Mossimo, Ocean Pacific/OP, Danskin, Rocawear, Cannon, Royal Velvet, Fieldcrest, Charisma, Starter and Waverly which it licenses directly to leading retailers, wholesalers and suppliers for use across a wide range of product categories, including, apparel, accessories, footwear, beauty and fragrance and home and in a variety of distribution channels from the mass tier to the luxury market. The company was formerly known as Candie's, Inc. and changed its name to Iconix Brand Group, Inc. in July 2005. Iconix Brand Group, Inc. was founded by Neil Cole in 1978 and is headquartered in New York, New York.
1 Year Total Return Performance
This total returns chart shows the returns to an investor from both price appreciation and dividends (dividends are assumed to be reinvested). Iconix Brand Group is down 34.62% over the last year vs S&P 500 Total Return up 1.18%, Deckers Outdoor Corporation down 36.37%, and EXCEED COMPANY down 59.38%.
- ICON Total Returns
- ^SPXTR Total Returns
- DECK Total Returns
- EDS Total Returns
Fundamentals
Fundamental analysis of a business involves analyzing its financial statements and health, its management and competitive advantages. The key financial statements of a company are the income statement, balance sheet and cash flow statement.
Cash Flow Statement View Statement
You may also be interested in these ICON related companies
Pro Strategies Featuring ICON
Did Iconix Brand Group make it into our Pro Portfolio Strategies?
ICON Charts
- Accounts Payable
- Accounts Receivable
- Accruals Pro
- Altman Z-Score Pro
- Asset Utilization
- Beneish M-Score Pro
- Beta Pro
- Book Value
- Book Value per Share
- Capital Expenditures
- Cash Conversion Cycle Pro
- Cash Div. Payout Ratio TTM Pro
- Cash Financing
- Cash Financing TTM
- Cash Investing
- Cash Investing TTM
- Cash Operations
- Cash Operations TTM
- Cash and Equivalents
- Cash and ST Investments
- Current Ratio
- Days Inventory Outstanding Pro
- Days Payable Outstanding Pro
- Days Sales Outstanding Pro
- Debt to Equity Ratio
- Dividend
- Dividend Yield
- EBITDA Margin TTM Pro
- EBITDA TTM Pro
- EV / EBIT Pro
- EV / EBITDA Pro
- EV / Free Cash Flow Pro
- EV / Revenues Pro
- Earnings Per Share
- Earnings Per Share Growth
- Earnings Per Share TTM
- Earnings Yield
- Effective Tax Rate TTM Pro
- Enterprise Value
- Expenses
- Expenses TTM
- Free Cash Flow
- Free Cash Flow TTM
- Free Cash Flow Yield Pro
- Fundamental Score Pro
- Gross Profit Margin
- Gross Profit TTM
- Income from Cont. Ops Pro
- Interest Expense
- Interest Income
- Inventories
- KZ Index Pro
- Liabilities
- Long Term Debt
- Market Cap
- Net Income
- Net Income TTM
- Net PP&E
- Operating Earnings Yield Pro
- Operating Margin TTM Pro
- Operating PE Ratio Pro
- Other Comprehensive Income Pro
- PE 10 Pro
- PE Ratio
- PE Value Pro
- PEG Ratio
- PS Value Pro
- Payout Ratio TTM Pro
- Price
- Price / Book Value
- Price / Sales Ratio
- Price / Tangible Book Value Pro
- Profit Margin
- R&D Expense
- Receivables Turnover
- Retained Earnings
- Retained Earnings Growth
- Return on Assets
- Return on Equity
- Return on Invested Capital Pro
- Revenue Growth
- Revenue Per Share TTM
- Revenues
- Revenues TTM
- SG&A Expense
- Shareholders Equity
- Shares Outstanding
- Stock Buybacks
- Tangible Book Value Pro
- Tangible Book Value Per Share Pro
- Tangible Common Equity Ratio Pro
- Times Interest Earned TTM Pro
- Total Assets
- Total Return Price
- Valuation (Historical Mult.) Pro
- Valuation Percentage Pro
- Value Score Pro
Other ICON Resources
- Company Website
- Wiki Page
- Investor Relations
- 13F Filings Whale Wisdom
- Call Transcripts Seeking Alpha
- Insider Trading Morningstar
- Institutional Ownership MSN Money
- SEC Filings SEC
- Technical Charts Chart.ly
- Trading Ideas Benzinga
Recent Quotes
| Symbol | Price | Chg | Chg % | Market Cap |
|---|---|---|---|---|
| ICON | 15.86 | +0.38 | +2.45% | 1.123B |
| ICLR | 21.90 | -0.03 | -0.14% | 1.319B |
| ICH | 4.11 | -0.05 | -1.20% | 29.91M |
| ICGE | 8.82 | +0.03 | +0.34% | 329.98M |
| IBA | 21.12 | +0.57 | +2.77% | 1.028B |
| IART | 35.59 | +0.30 | +0.85% | 948.60M |
| IAK | 29.77 | +0.26 | +0.88% | |
| IAG | 10.58 | -0.29 | -2.67% | 4.088B |
| IAF | 9.81 | +0.41 | +4.36% | |
| IAE | 14.79 | +0.14 | +0.96% |