

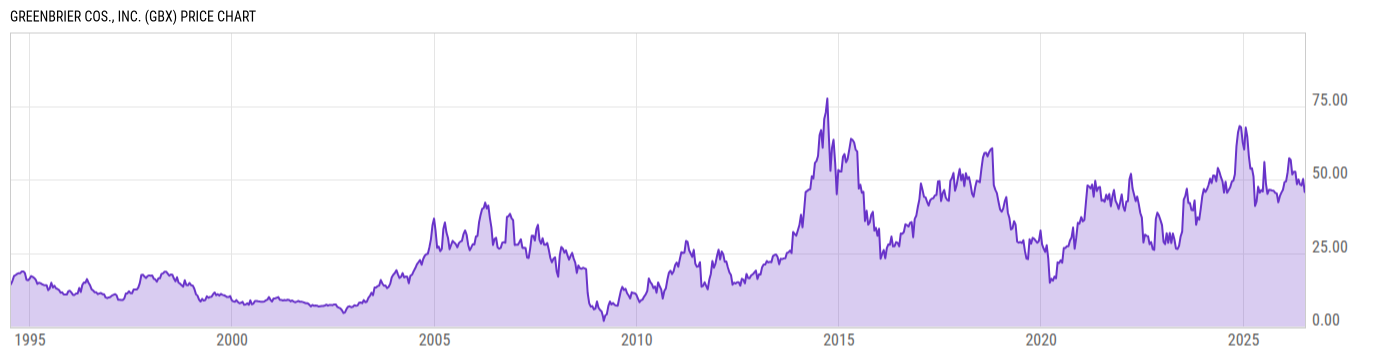
Greenbrier Cos., Inc. (GBX)
47.30
+0.64
(+1.37%)
USD |
NYSE |
Jul 10, 16:00
47.30
0.00 (0.00%)
Pre-Market: 20:00
Price Chart
Key Stats
| Price and Performance | |
|---|---|
| Market Cap | 1.463B |
| 52 Week High (Daily) | |
| 52 Week Low (Daily) | |
| All-Time High (Daily) | |
| Year to Date Total Returns (Daily) | |
| 1 Month Total Returns (Daily) | |
| 1 Year Total Returns (Daily) | -12.37% |
| Valuation | |
| PE Ratio | 13.90 |
| PE Ratio (Forward) | |
| PS Ratio | 0.5686 |
| Price to Book Value | 0.9302 |
| EV to EBITDA | |
| Dividend | |
|---|---|
| Dividend | 0.34 |
| Dividend Yield (Forward) | |
| Financials | |
| Revenue (5 Year Growth) | |
| Revenue (Quarterly YoY Growth) | |
| EPS Diluted (5 Year Growth) | |
| EPS Diluted (Quarterly YoY Growth) | |
| Debt to Equity Ratio | 1.195 |
| Return on Equity | |
| Return on Assets | |
| Risk | |
| Beta (5Y) | |
| Max Drawdown (5Y) | 57.07% |
Profile
| Greenbrier Cos., Inc. engages in the design, manufacture, and marketing of railroad freight car equipment. It operates through the following segments: Manufacturing, Maintenance Services, and Leasing and Management Services. The Manufacturing segment includes double-stack intermodal railcars, tank cars, freight railcars, and automotive railcar products. The Maintenance Services segment focuses on wheel and axle services, railcar maintenance, and component part manufacturing. The Leasing & Management Services segment refers to the leasing and management services in North America through its subsidiaries. The company was founded by William A. Furman in 1919 and is headquartered in Lake Oswego, OR. |
| URL | http://www.gbrx.com |
| Investor Relations URL | https://investors.gbrx.com/ |
| HQ State/Province | Oregon |
| Sector | Industrials |
| Industry | Machinery |
| Equity Style | Small Cap Value |
| Next Earnings Release | Oct. 28, 2026 (est.) |
| Last Earnings Release | Jul. 01, 2026 |
| Next Ex-Dividend Date | Jul. 16, 2026 |
| Last Ex-Dividend Date | Apr. 20, 2026 |