

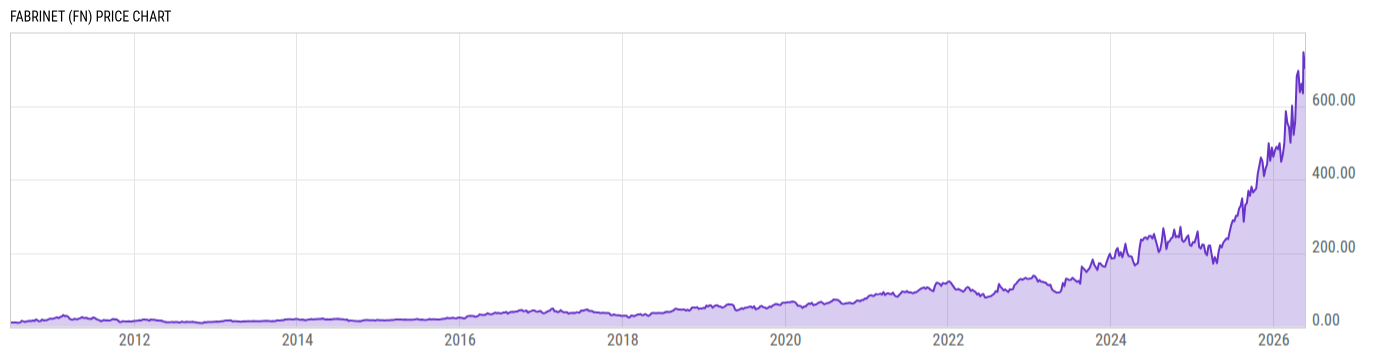
Fabrinet (FN)
630.50
+6.80
(+1.09%)
USD |
NYSE |
Jun 09, 09:30
Price Chart
Key Stats
| Price and Performance | |
|---|---|
| Market Cap | 22.59B |
| 52 Week High (Daily) | |
| 52 Week Low (Daily) | |
| All-Time High (Daily) | |
| Year to Date Total Returns (Daily) | |
| 1 Month Total Returns (Daily) | |
| 1 Year Total Returns (Daily) | 165.5% |
| Valuation | |
| PE Ratio | 54.21 |
| PE Ratio (Forward) | |
| PS Ratio | 5.387 |
| Price to Book Value | 9.802 |
| EV to EBITDA | |
| Dividend | |
|---|---|
| Dividend | -- |
| Dividend Yield (Forward) | |
| Financials | |
| Revenue (5 Year Growth) | |
| Revenue (Quarterly YoY Growth) | |
| EPS Diluted (5 Year Growth) | |
| EPS Diluted (Quarterly YoY Growth) | |
| Debt to Equity Ratio | 0.0019 |
| Return on Equity | |
| Return on Assets | |
| Risk | |
| Beta (5Y) | |
| Max Drawdown (5Y) | 38.70% |
Profile
| Fabrinet engages in the provision of optical packaging and electronic manufacturing services to original equipment manufacturers. The firm's engineering services include process design, failure analysis, reliability testing, tooling design, and real-time traceability system. Its manufacturing operations offer sensors, subsystems, customized optics, and optical modules and components. The company was founded by David Thomas Mitchell on August 12, 1999 and is headquartered in George Town, Cayman Islands. |
| URL | http://www.fabrinet.com |
| Investor Relations URL | https://investor.fabrinet.com |
| HQ State/Province | George Town |
| Sector | Information Technology |
| Industry | Electronic Equipment, Instruments & Components |
| Next Earnings Release | Aug. 17, 2026 (est.) |
| Last Earnings Release | May. 04, 2026 |
| Next Ex-Dividend Date | N/A |
| Last Ex-Dividend Date | N/A |