

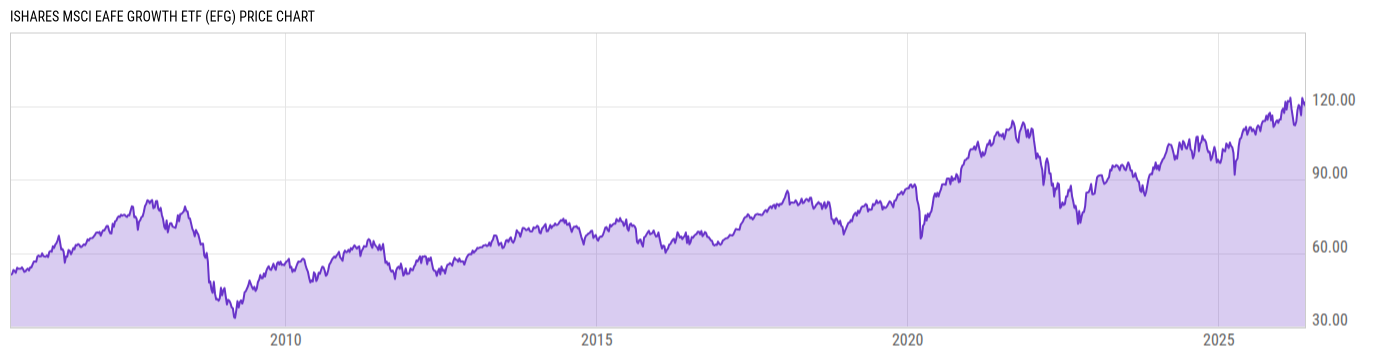
iShares MSCI EAFE Growth ETF (EFG)
121.26
+1.36
(+1.13%)
USD |
BATS |
Jun 08, 16:00
121.22
-0.04
(-0.03%)
Pre-Market: 20:00
Price Chart
Key Stats
| Net Expense Ratio | Discount or Premium to NAV | Total Assets Under Management | 30-Day Average Daily Volume |
|---|---|---|---|
| 0.34% | 0.23% | 16.26B | 937582.2 |
| Weighted Average Dividend Yield | Turnover Ratio (Generic) | 1 Year Fund Level Flows | Max Drawdown (Since Inception) |
| 1.54% | 23.00% | 915.97M |
Basic Info
| Investment Strategy | |
| The Fund seeks investment results that correspond generally to the price and yield performance, before fees and expenses, of the MSCI EAFE Growth Index. The Index is a subset of the MSCI EAFE Index and constituents of the Index include securities from Europe, Australasia (Australia and Asia), and the Far East. |
| General | |
| Security Type | Exchange-Traded Fund |
| Equity Style | Large Cap Growth |
| Broad Asset Class | International Equity |
| Broad Category | Equity |
| Global Peer Group | Equity Global ex US |
| Peer Group | International Large-Cap Growth |
| Global Macro | Equity Global |
| US Macro | Developed International Markets Funds |
| YCharts Categorization | -- |
| YCharts Benchmark | -- |
| Prospectus Objective | International Funds |
| Fund Owner Firm Name | BlackRock |
| Broad Asset Class Benchmark Index | |
| ^MSACXUSNTR | 100.0% |
Performance Versus Peer Group
Annual Total Returns Versus Peers
As of June 09, 2026.
Asset Allocation
As of May 31, 2026.
| Type | % Net |
|---|---|
| Cash | 0.45% |
| Stock | 99.11% |
| Bond | 0.01% |
| Convertible | 0.00% |
| Preferred | 0.07% |
| Other | 0.36% |
Basic Info
| Investment Strategy | |
| The Fund seeks investment results that correspond generally to the price and yield performance, before fees and expenses, of the MSCI EAFE Growth Index. The Index is a subset of the MSCI EAFE Index and constituents of the Index include securities from Europe, Australasia (Australia and Asia), and the Far East. |
| General | |
| Security Type | Exchange-Traded Fund |
| Equity Style | Large Cap Growth |
| Broad Asset Class | International Equity |
| Broad Category | Equity |
| Global Peer Group | Equity Global ex US |
| Peer Group | International Large-Cap Growth |
| Global Macro | Equity Global |
| US Macro | Developed International Markets Funds |
| YCharts Categorization | -- |
| YCharts Benchmark | -- |
| Prospectus Objective | International Funds |
| Fund Owner Firm Name | BlackRock |
| Broad Asset Class Benchmark Index | |
| ^MSACXUSNTR | 100.0% |