

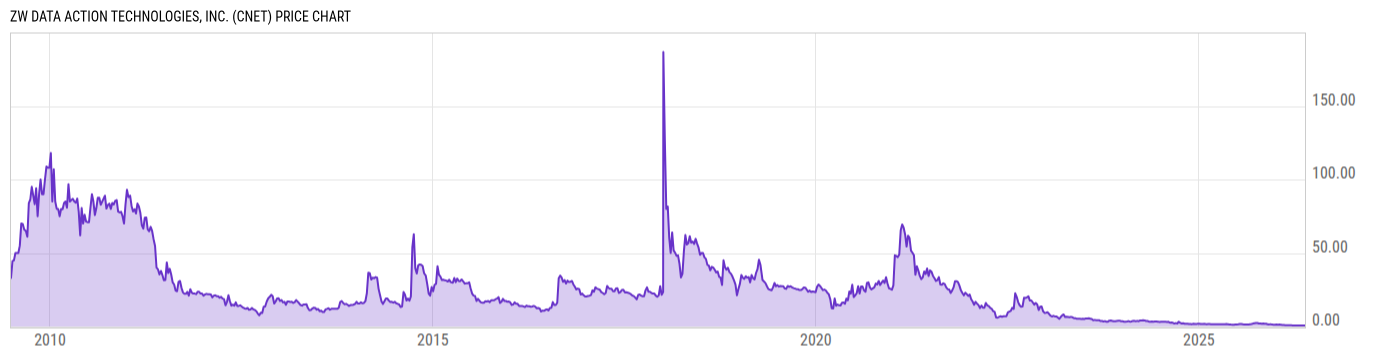
ZW Data Action Technologies, Inc. (CNET)
1.03
-0.05
(-4.63%)
USD |
NASDAQ |
Jun 11, 16:00
1.03
0.00 (0.00%)
After-Hours: 20:00
Price Chart
Key Stats
| Price and Performance | |
|---|---|
| Market Cap | 3.366M |
| 52 Week High (Daily) | |
| 52 Week Low (Daily) | |
| All-Time High (Daily) | |
| Year to Date Total Returns (Daily) | |
| 1 Month Total Returns (Daily) | |
| 1 Year Total Returns (Daily) | -14.62% |
| Valuation | |
| PE Ratio | -- |
| PE Ratio (Forward) | |
| PS Ratio | 0.8914 |
| Price to Book Value | 0.7807 |
| EV to EBITDA | |
| Dividend | |
|---|---|
| Dividend | -- |
| Dividend Yield (Forward) | |
| Financials | |
| Revenue (5 Year Growth) | |
| Revenue (Quarterly YoY Growth) | |
| EPS Diluted (5 Year Growth) | |
| EPS Diluted (Quarterly YoY Growth) | |
| Debt to Equity Ratio | 0.0378 |
| Return on Equity | |
| Return on Assets | |
| Risk | |
| Beta (5Y) | |
| Max Drawdown (5Y) | 99.44% |
Profile
| ZW Data Action Technologies, Inc. is a holding company, which engages in the operation of a one-stop services on omni-channel advertising, precision marketing, and data analysis management system. It also engages in the development of blockchain enabled web/mobile applications and provision of software solutions. It operates through the following segments: Internet Advertising and Data Services, Ecommerce O2O Advertising and Marketing Services, Blockchain Technology, and Corporate. The company was founded by Han Dong Cheng and Zhi Ge Zhang in 2003 and is headquartered in Beijing, China. |
| URL | http://www.zdat.com |
| Investor Relations URL | http://investor.chinanet-online.com/ |
| HQ State/Province | Guangdong |
| Sector | Communication Services |
| Industry | Media |
| Equity Style | Small Cap Value |
| Next Earnings Release | N/A |
| Last Earnings Release | Aug. 20, 2018 |
| Next Ex-Dividend Date | N/A |
| Last Ex-Dividend Date | N/A |