

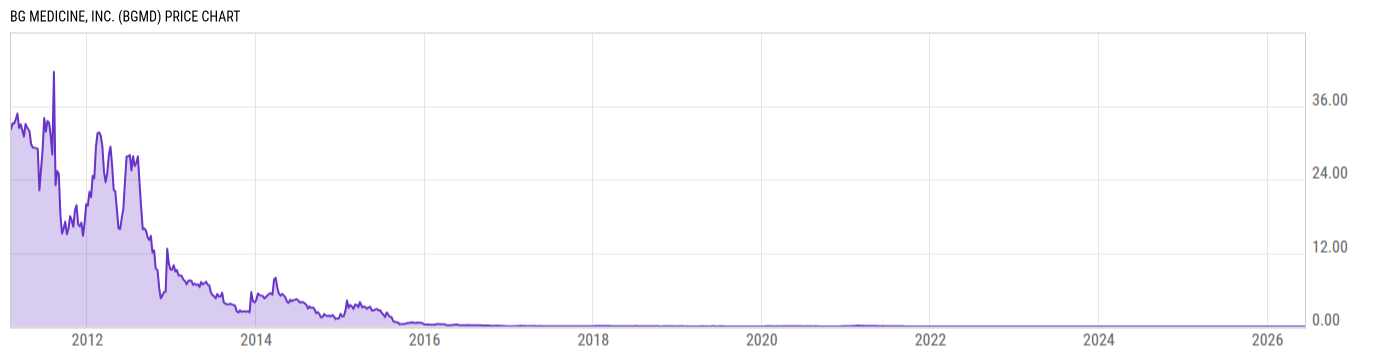
BG Medicine, Inc. (BGMD)
0.0000
0.00 (0.00%)
USD |
OTCM |
Jun 17, 16:00
Price Chart
Key Stats
| Price and Performance | |
|---|---|
| Market Cap | 0.00 |
| 52 Week High (Daily) | |
| 52 Week Low (Daily) | |
| All-Time High (Daily) | |
| Year to Date Total Returns (Daily) | |
| 1 Month Total Returns (Daily) | |
| 1 Year Total Returns (Daily) | 0.00% |
| Valuation | |
| PE Ratio | -- |
| PE Ratio (Forward) | |
| PS Ratio | -- |
| Price to Book Value | -- |
| EV to EBITDA | |
| Dividend | |
|---|---|
| Dividend | -- |
| Dividend Yield (Forward) | |
| Financials | |
| Revenue (5 Year Growth) | |
| Revenue (Quarterly YoY Growth) | |
| EPS Diluted (5 Year Growth) | |
| EPS Diluted (Quarterly YoY Growth) | |
| Debt to Equity Ratio | -- |
| Return on Equity | |
| Return on Assets | |
| Risk | |
| Beta (5Y) | |
| Max Drawdown (5Y) | 100.00% |
Profile
| BG Medicine, Inc. is a life sciences company, which engages in the provision of developing and delivering innovative solutions for healthcare providers that provide insight and transform the clinical care of heart failure and related disorders. The firm distributes products such as BGM Galectin-3 to clinical laboratories, hospitals, and healthcare providers. The company was founded in February 2000 by Jan van der Greef and is headquartered in Waltham, MA. |
| URL | http://www.bg-medicine.com |
| Investor Relations URL | N/A |
| HQ State/Province | Massachusetts |
| Sector | Health Care |
| Industry | Life Sciences Tools & Services |
| Equity Style | N/A |
| Next Earnings Release | N/A |
| Last Earnings Release | Nov. 12, 2015 |
| Next Ex-Dividend Date | N/A |
| Last Ex-Dividend Date | N/A |