

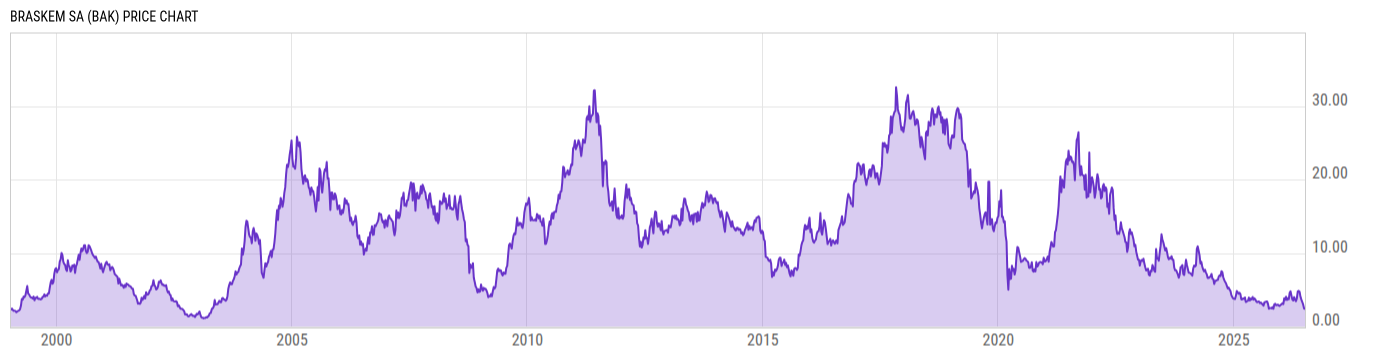
Braskem SA (BAK)
2.40
+0.01
(+0.42%)
USD |
NYSE |
Jul 07, 16:00
2.43
+0.03
(+1.25%)
Pre-Market: 06:58
Price Chart
Key Stats
| Price and Performance | |
|---|---|
| Market Cap | 414.07M |
| 52 Week High (Daily) | |
| 52 Week Low (Daily) | |
| All-Time High (Daily) | |
| Year to Date Total Returns (Daily) | |
| 1 Month Total Returns (Daily) | |
| 1 Year Total Returns (Daily) | -29.20% |
| Valuation | |
| PE Ratio | -- |
| PE Ratio (Forward) | |
| PS Ratio | 0.0781 |
| Price to Book Value | -- |
| EV to EBITDA | |
| Dividend | |
|---|---|
| Dividend | -- |
| Dividend Yield (Forward) | |
| Financials | |
| Revenue (5 Year Growth) | |
| Revenue (Quarterly YoY Growth) | |
| EPS Diluted (5 Year Growth) | |
| EPS Diluted (Quarterly YoY Growth) | |
| Debt to Equity Ratio | -4.299 |
| Return on Equity | |
| Return on Assets | |
| Risk | |
| Beta (5Y) | |
| Max Drawdown (5Y) | 89.86% |
Profile
| Braskem SA engages in the manufacture of petrochemicals and other related products. It operates through the following segments: Brazil, USA, and Europe and Mexico. The Brazil segment includes production and sale of chemicals, supply of electricity, and production and sale of PE. The USA and Europe segment involves production, operation, and sale of polypropylene in the United States and Germany. The Mexico segment comprises production, operation, and sale of ethylene, high-density polyethylene and low-density polyethylene in Mexico. The company was founded in August 2002 and is headquartered in Butanta, Brazil. |
| URL | http://www.braskem.com.br |
| Investor Relations URL | https://www.braskem-ri.com.br/ |
| HQ State/Province | Bahia |
| Sector | Materials |
| Industry | Chemicals |
| Equity Style | Small Cap Value |
| Next Earnings Release | Aug. 12, 2026 (est.) |
| Last Earnings Release | May. 13, 2026 |
| Next Ex-Dividend Date | N/A |
| Last Ex-Dividend Date | Dec. 10, 2021 |