

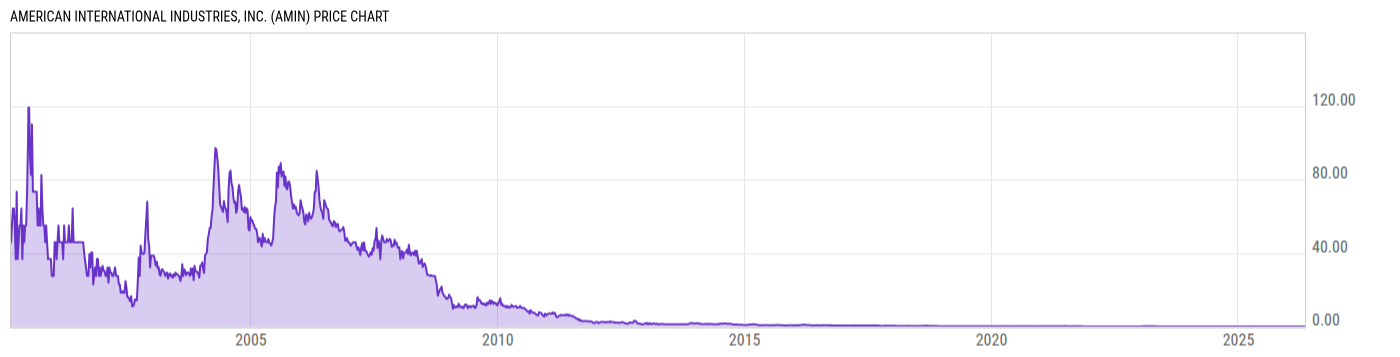
American International Industries, Inc. (AMIN)
0.15
0.00 (0.00%)
USD |
OTCM |
Jun 05, 16:00
Price Chart
Key Stats
| Price and Performance | |
|---|---|
| Market Cap | 1.811M |
| 52 Week High (Daily) | |
| 52 Week Low (Daily) | |
| All-Time High (Daily) | |
| Year to Date Total Returns (Daily) | |
| 1 Month Total Returns (Daily) | |
| 1 Year Total Returns (Daily) | 149.9K% |
| Valuation | |
| PE Ratio | -- |
| PE Ratio (Forward) | |
| PS Ratio | 63.88 |
| Price to Book Value | -- |
| EV to EBITDA | |
| Dividend | |
|---|---|
| Dividend | -- |
| Dividend Yield (Forward) | |
| Financials | |
| Revenue (5 Year Growth) | |
| Revenue (Quarterly YoY Growth) | |
| EPS Diluted (5 Year Growth) | |
| EPS Diluted (Quarterly YoY Growth) | |
| Debt to Equity Ratio | -0.1441 |
| Return on Equity | |
| Return on Assets | |
| Risk | |
| Beta (5Y) | |
| Max Drawdown (5Y) | 99.97% |
Profile
| American International Industries, Inc. is an investment holding company, which engages in the provision of interests in industry, finance, real estate and oil and gas. The company was founded in September 1994 and is headquartered in Kemah, TX. |
| URL | http://www.americaii.com |
| Investor Relations URL | N/A |
| HQ State/Province | Texas |
| Sector | Industrials |
| Industry | Industrial Conglomerates |
| Next Earnings Release | N/A |
| Last Earnings Release | Nov. 11, 2010 |
| Next Ex-Dividend Date | N/A |
| Last Ex-Dividend Date | Aug. 24, 2005 |