

US GDP (I:USGDP)
Level Chart
Basic Info
|
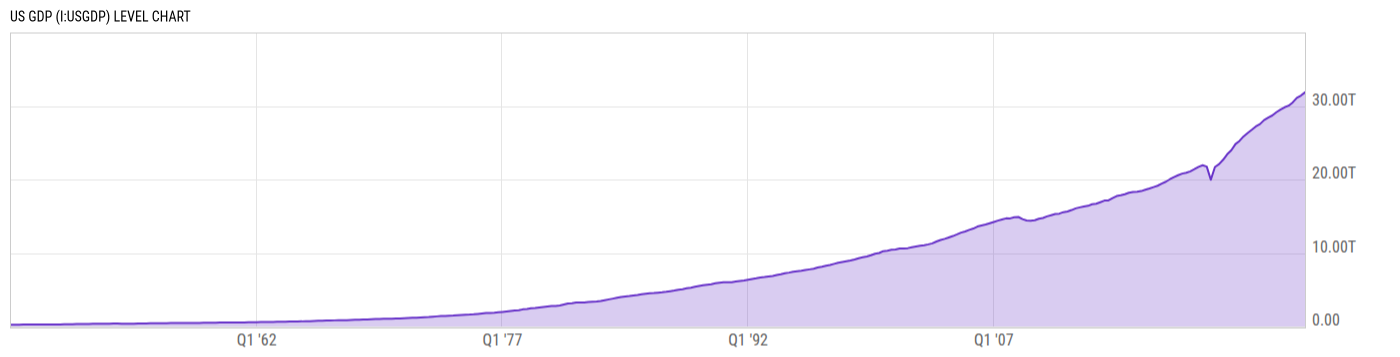
US GDP is at a current level of 31.82T, up from 31.42T last quarter and up from 30.04T one year ago. This is a change of 1.26% from last quarter and 5.92% from one year ago. |
|
US GDP or Gross Domestic Product is the total value of goods produced and services provided in the US. It is a vital indicator to analyze the health of the US economy. The metric is calculated as the sum of Private Consumption, Gross Investment, Government Spending and Net Exports. Two quarters of consecutive negative real GDP growth signifies a recession. Additionally, GDP is used by the FOMC as a gauge to make their interest rate decisions. In the post World War II boom years, US GDP grew as high as 26.80% in a year, but by the late 20th century 2-7% nominal growth was more the norm. |
| Report | Gross Domestic Product (GDP) |
| Category | GDP |
| Region | United States |
| Source | Bureau of Economic Analysis |
Stats
| Last Value | 31.82T |
| Latest Period | Mar 2026 |
| Last Updated | May 28 2026, 08:32 EDT |
| Next Release | Jun 25 2026, 08:30 EDT (R) |
| Average Growth Rate | 6.25% |
| Value from Last Quarter | 31.42T |
| Change from Last Quarter | 1.26% |
| Value from 1 Year Ago | 30.04T |
| Change from 1 Year Ago | 5.92% |
| Frequency | Quarterly |
| Unit | USD |
| Adjustment | Seasonally Adjusted Annual Rate |
| Download Source File |
Historical Data
| Date | Value |
|---|---|
| March 31, 2026 | 31.82T |
| December 31, 2025 | 31.42T |
| September 30, 2025 | 31.10T |
| June 30, 2025 | 30.49T |
| March 31, 2025 | 30.04T |
| December 31, 2024 | 29.83T |
| September 30, 2024 | 29.51T |
| June 30, 2024 | 29.15T |
| March 31, 2024 | 28.71T |
| December 31, 2023 | 28.42T |
| September 30, 2023 | 28.07T |
| June 30, 2023 | 27.53T |
| March 31, 2023 | 27.22T |
| December 31, 2022 | 26.77T |
| September 30, 2022 | 26.34T |
| June 30, 2022 | 25.86T |
| March 31, 2022 | 25.25T |
| December 31, 2021 | 24.81T |
| September 30, 2021 | 23.98T |
| June 30, 2021 | 23.43T |
| March 31, 2021 | 22.68T |
| December 31, 2020 | 22.09T |
| September 30, 2020 | 21.70T |
| June 30, 2020 | 19.96T |
| March 31, 2020 | 21.75T |
| Date | Value |
|---|---|
| December 31, 2019 | 21.93T |
| September 30, 2019 | 21.72T |
| June 30, 2019 | 21.40T |
| March 31, 2019 | 21.11T |
| December 31, 2018 | 20.92T |
| September 30, 2018 | 20.80T |
| June 30, 2018 | 20.58T |
| March 31, 2018 | 20.33T |
| December 31, 2017 | 20.04T |
| September 30, 2017 | 19.69T |
| June 30, 2017 | 19.44T |
| March 31, 2017 | 19.15T |
| December 31, 2016 | 18.97T |
| September 30, 2016 | 18.78T |
| June 30, 2016 | 18.61T |
| March 31, 2016 | 18.43T |
| December 31, 2015 | 18.33T |
| September 30, 2015 | 18.31T |
| June 30, 2015 | 18.19T |
| March 31, 2015 | 17.99T |
| December 31, 2014 | 17.85T |
| September 30, 2014 | 17.74T |
| June 30, 2014 | 17.46T |
| March 31, 2014 | 17.14T |
| December 31, 2013 | 17.13T |
News
Basic Info
|
US GDP is at a current level of 31.82T, up from 31.42T last quarter and up from 30.04T one year ago. This is a change of 1.26% from last quarter and 5.92% from one year ago. |
|
US GDP or Gross Domestic Product is the total value of goods produced and services provided in the US. It is a vital indicator to analyze the health of the US economy. The metric is calculated as the sum of Private Consumption, Gross Investment, Government Spending and Net Exports. Two quarters of consecutive negative real GDP growth signifies a recession. Additionally, GDP is used by the FOMC as a gauge to make their interest rate decisions. In the post World War II boom years, US GDP grew as high as 26.80% in a year, but by the late 20th century 2-7% nominal growth was more the norm. |
| Report | Gross Domestic Product (GDP) |
| Category | GDP |
| Region | United States |
| Source | Bureau of Economic Analysis |
Stats
| Last Value | 31.82T |
| Latest Period | Mar 2026 |
| Last Updated | May 28 2026, 08:32 EDT |
| Next Release | Jun 25 2026, 08:30 EDT (R) |
| Average Growth Rate | 6.25% |
| Value from Last Quarter | 31.42T |
| Change from Last Quarter | 1.26% |
| Value from 1 Year Ago | 30.04T |
| Change from 1 Year Ago | 5.92% |
| Frequency | Quarterly |
| Unit | USD |
| Adjustment | Seasonally Adjusted Annual Rate |
| Download Source File |
Related Indicators
| US Economy |
| ADP Employment Change | 122000.0 |
| Effective Federal Funds Rate | 3.62% |
| US Durable Goods New Orders MoM | 7.95% |
| US Housing Starts MoM | -2.79% |
| US Imports MoM | 2.03% |
| US Index of Consumer Sentiment | 44.80 |
| US Inflation Rate | 3.80% |
| US Initial Claims for Unemployment Insurance | 225000.0 |
| US ISM Manufacturing PMI | 54.00 |
| US Real GDP QoQ | 1.60% |
| US Retail and Food Services Sales MoM | 0.49% |
| US Unemployment Rate | 4.30% |