

Timeseries Tables
Analyze how a financial metric or economic figure has changed over time, compile data at an interval of your choosing, and export in a highly usable and intuitive format.
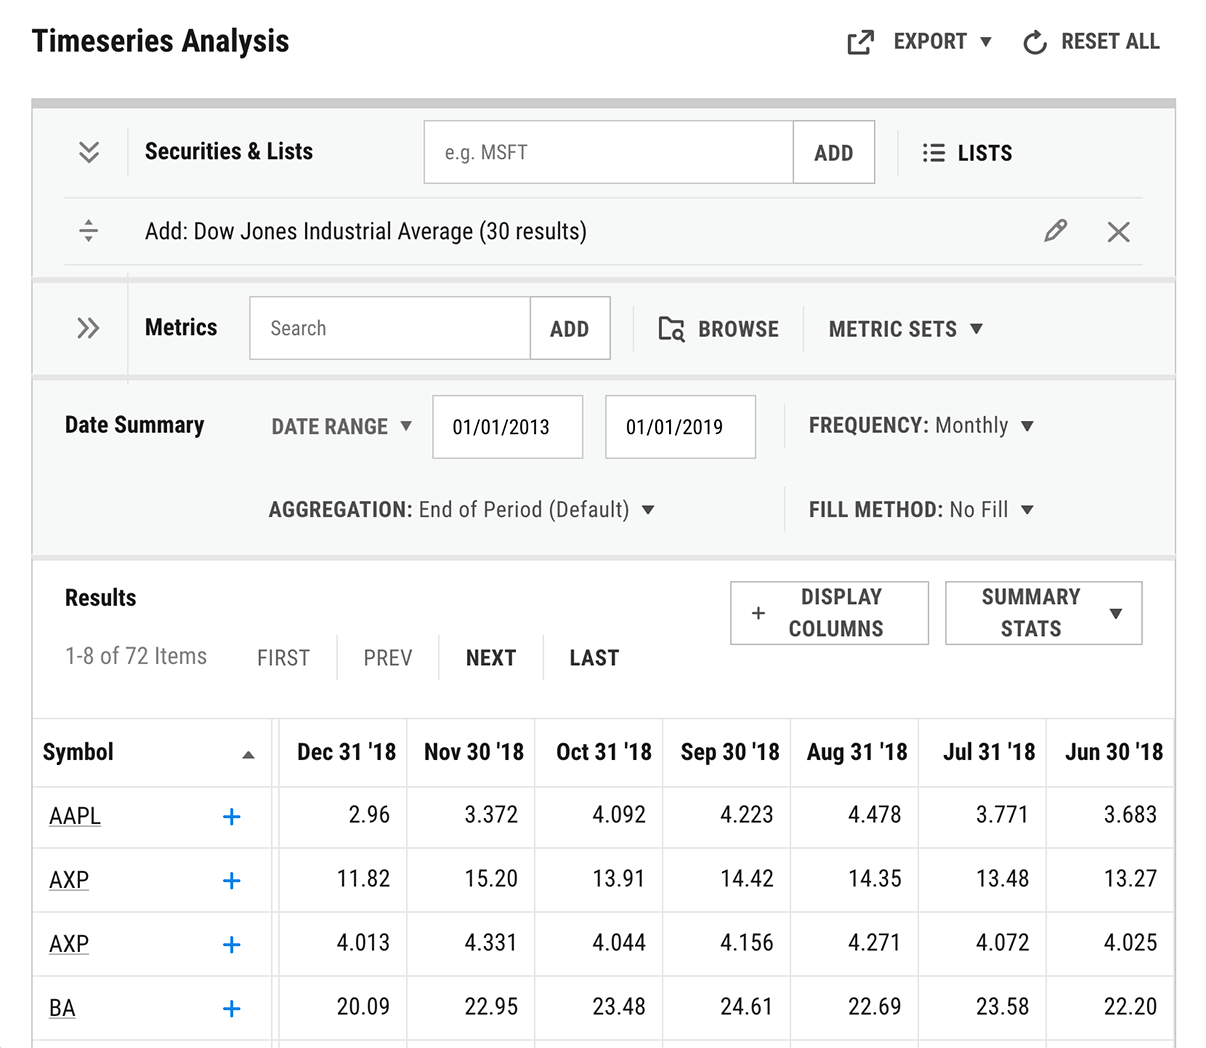
Compile Historical Data for Securities and Macroeconomic Indicators
Access raw historical data for stocks, funds, indices, and macroeconomic data in an intuitive and easy to navigate interface. To make your modeling faster, Timeseries Analysis compiles data for your desired metrics, time period, and frequency before exporting directly to Excel.
Make the Data Work for You
Time is valuable. Bypass the burden of organizing and formatting data and use your time to actually analyze. YCharts’ Timeseries Analysis tool formats data at any frequency from daily to annual, and 15 options in between.
YCharts’ Timeseries Tables are available with a YCharts Analyst subscription. To learn more and see it in action, please contact a sales representative today.
QUESTIONS?
- Email: support@ycharts.com
- Call: (866) 965-7552
READY TO GET STARTED?
Unlock My AccessAccess Data Tables Now
Unlock access to Data Tables by registering below. No credit card required.
Unlock My AccessQUESTIONS?
- Email: support@ycharts.com
- Call: (866) 965-7552