

Alexandria Real Estate Equities, Inc., at the Vanguard of the Life Science Industry, Providing High-Quality Office/Laboratory Space to Meet Historic-High Demand, Reports: 4Q21 and 2021 Net Income per Share - Diluted of $0.47 and $3.82, respectively; 4Q21 and 2021 FFO per Share - Diluted, As Adjusted, of $1.97 and $7.76, respectively
PASADENA, Calif., Jan. 31, 2022 /PRNewswire/ -- Alexandria Real Estate Equities, Inc. (NYSE:ARE) announced financial and operating results for the fourth quarter and year ended December 31, 2021.


Key highlights | ||||||||
Operating results | 4Q21 | 4Q20 | 2021 | 2020 | ||||
Total revenues: | ||||||||
In millions | $ 576.9 | $ 463.7 | $ 2,114.2 | $ 1,885.6 | ||||
Growth | 24.4% | 12.1% | ||||||
Net income attributable to Alexandria's common stockholders – diluted | ||||||||
In millions | $ 72.8 | $ 435.9 | $ 563.4 | $ 760.8 | ||||
Per share | $ 0.47 | $ 3.26 | $ 3.82 | $ 6.01 | ||||
Funds from operations attributable to Alexandria's common stockholders – diluted, as adjusted | ||||||||
In millions | $ 303.6 | $ 246.6 | $ 1,144.9 | $ 923.8 | ||||
Per share | $ 1.97 | $ 1.84 | $ 7.76 | $ 7.30 | ||||
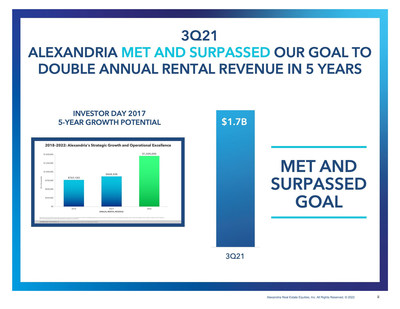
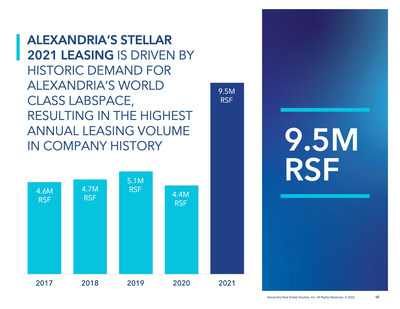
Historic leasing volume and rental rate growth
- Historic demand for our high-quality office/laboratory space has translated into record leasing volume and rental rate growth in 2021 for our overall portfolio and our value-creation pipeline.
4Q21 | Previous | 2021 | Previous | |||||
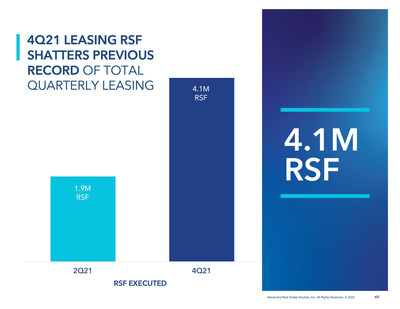
Total leasing activity – RSF | 4,094,174 | (1) | 1,933,838 | 9,516,301 | (1) | 5,062,722 | ||
Leasing of development and redevelopment | 1,795,633 | (1) | 1,063,951 | 3,867,383 | (1) | 2,258,262 | ||
Lease renewals and re-leasing of space: | ||||||||
RSF (included in total leasing activity above) | 1,947,727 | (1) | 1,472,713 | 4,614,040 | (1) | 2,562,178 | ||
Rental rate increases | 35.9% | 37.9% | (1) | 37.6% | ||||
Rental rate increases (cash basis) | 22.9% | 22.6% | (1) | 18.3% | ||||
(1) Represents the highest leasing volume and rental rate growth in Company history. | ||||||||
Continued strong net operating income and internal growth
- Net operating income (cash basis) of $1.4 billion for 4Q21 annualized, up $279.9 million, or 24.2%, compared to 4Q20 annualized.
- 95% of our leases contain contractual annual rent escalations approximating 3%.
- Same property net operating income growth:
- 5.0% and 7.5% (cash basis) for 4Q21 over 4Q20.
- 4.2% and 7.1% (cash basis) for 2021 over 2020.
A REIT industry-leading high-quality tenant roster with high-quality revenues and cash flows, strong margins, and operational excellence; growth of 100 bps in occupancy over 4Q20(1)
Percentage of total annual rental revenue in effect from investment-grade or | 51% | |||
Occupancy of operating properties in North America | 94.0% | |||
Occupancy of operating properties in North America (excluding vacancy at | 98.7% | (1) | ||
Operating margin | 70% | |||
Adjusted EBITDA margin | 71% | |||
Weighted-average remaining lease term: | ||||
All tenants | 7.5 | years | ||
Top 20 tenants | 10.9 | years | ||
(1) | Excludes 1.8 million RSF, or 4.7%, of vacancy at recently acquired properties representing lease-up opportunities that are expected to provide incremental annual rental revenues. Excluding recently acquired vacancies, occupancy was 98.7% as of December 31, 2021, up 100 bps from 97.7% as of December 31, 2020. Refer to "Occupancy" in our Supplemental Information. |
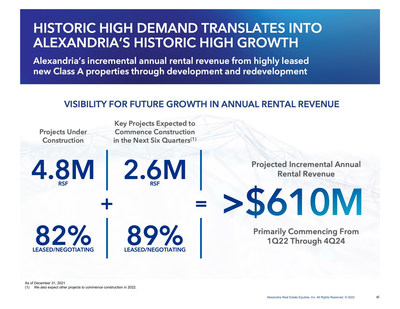
Historic high demand drives visibility for future growth aggregating $610 million of incremental annual rental revenue from 7.4 million RSF of value-creation projects that are 83% leased/negotiating
Our highly leased value-creation pipeline of current and near-term projects that are under construction or that will commence construction in the next six quarters is expected to generate greater than $610 million of incremental annual rental revenues, primarily commencing from 1Q22 through 4Q24.
- 7.4 million RSF of our value-creation projects are either under construction or expected to commence construction in the next six quarters.
- 83% leased/negotiating.
Strong and flexible balance sheet with significant liquidity
- Investment-grade credit ratings ranked in the top 10% among all publicly traded U.S. REITs as of December 31, 2021.
- Net debt and preferred stock to Adjusted EBITDA of 5.2x and fixed-charge coverage ratio of 5.3x for 4Q21 annualized, representing the best ratios in the past 10 years.
- Total debt and preferred stock to gross assets of 26% as of December 31, 2021.
- $5.4 billion liquidity as of December 31, 2021, including our outstanding forward equity sales agreements entered into in January 2022.
Strategic value harvesting and asset recycling
During 4Q21, we completed $2.0 billion in dispositions and partial interest sales at an average capitalization rate (cash basis) of 4.2%.
Continued dividend strategy to share growth in cash flows with stockholders
Common stock dividend declared for 4Q21 of $1.15 per common share, aggregating $4.48 per common share for the year ended December 31, 2021, up 24 cents, or 6%, over the year ended December 31, 2020. Our FFO payout ratio of 60% for the three months ended December 31, 2021 allows us to continue to share growth in cash flows from operating activities with our stockholders while also retaining a significant portion for reinvestment.
Key items included in operating results
Key items included in net income attributable to Alexandria's common stockholders: | |||||||||||||||
4Q21 | 4Q20 | 4Q21 | 4Q20 | 2021 | 2020 | 2021 | 2020 | ||||||||
(In millions, except per share | Amount | Per Share – | Amount | Per Share – | |||||||||||
Unrealized (losses) gains on | $ (139.7) | $ 233.5 | $ (0.91) | $ 1.75 | $ 43.6 | $ 374.0 | $ 0.30 | $ 2.96 | |||||||
Significant realized gains on | — | — | — | — | 110.1 | — | 0.75 | — | |||||||
Gain on sales of real estate | 124.2 | (1) | 152.5 | 0.80 | 1.14 | 126.6 | 154.1 | 0.86 | 1.22 | ||||||
Impairment of real estate | — | (25.2) | — | (0.19) | (52.7) | (55.7) | (0.35) | (0.44) | |||||||
Impairment of non-real estate | — | — | — | — | — | (24.5) | — | (0.19) | |||||||
Loss on early extinguishment | — | (7.9) | — | (0.06) | (67.3) | (60.7) | (0.46) | (0.48) | |||||||
Termination fee | — | — | — | — | — | 86.2 | — | 0.68 | |||||||
Acceleration of stock | — | — | — | — | — | (4.5) | — | (0.04) | |||||||
Total | $ (15.5) | $ 352.9 | $ (0.11) | $ 2.64 | $ 160.3 | $ 468.9 | $ 1.10 | $ 3.71 | |||||||
(1) Refer to "Funds from operations and funds from operations per share" of this Earnings Press Release for additional details. | |||||||||||||||
External growth and investment in real estate
Alexandria at the vanguard of innovation for over 850 tenants, with a focus on accommodating current tenant needs and providing a path for their future growth
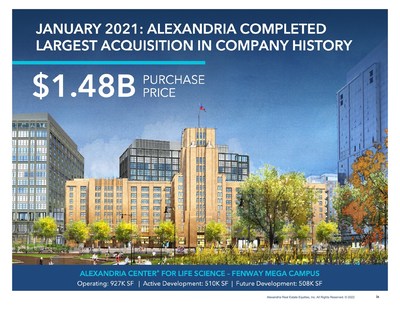
- During 4Q21, we completed acquisitions in our key life science cluster submarkets aggregating 4.1 million SF, comprising 3.9 million RSF of future development opportunities and 191,879 RSF of operating space, for an aggregate purchase price of $1.5 billion, including our previously announced acquisition of One Rogers Street in our Cambridge submarket for a purchase price of $849.4 million. These acquisitions are primarily focused on future development or redevelopment opportunities to expand our mega campuses and accommodate the future growth of our tenants.
Delivery and commencement of value-creation projects
- During 4Q21, we placed into service development and redevelopment projects aggregating 600,768 RSF that are 100% leased across multiple submarkets.
- Annual net operating income (cash basis) is expected to increase by $39 million upon the burn-off of initial free rent from recently delivered projects.
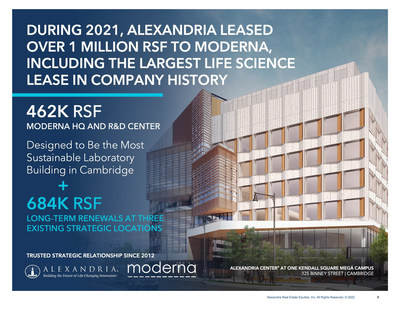
- During 4Q21, we commenced construction on four value-creation projects aggregating 1.1 million RSF, including a 403,892 RSF recently acquired redevelopment project at One Rogers Street, which expands our Alexandria Center® at Kendall Square mega campus in Cambridge. We pre-leased the entire building by executing leases aggregating 403,892 RSF prior to the closing of the acquisition in December 2021.
- In January 2022, we completed the acquisition of 202,997 SF additional development entitlements, for an aggregate of 507,997 SF, at our 421 Park Drive future development site in our Alexandria Center® for Life Science – Fenway mega campus in our Fenway submarket.
Value-creation pipeline of new Class A development and redevelopment projects as | 4Q21 | |
Under construction projects 82% leased/negotiating | 9% | |
Pre-leased/negotiating near-term projects 89% leased/negotiating | 2% | |
Income-producing/potential cash flows/covered land play(1) | 6% | |
Land | 2% | |
(1) | Includes projects that have existing buildings that are generating or can generate operating cash flows. Also includes development rights associated with existing operating campuses. |
Balance sheet management
Credit rating outlook improvement
In October 2021, S&P Global Ratings upgraded our corporate issuer credit rating outlook to BBB+/Positive from BBB+/Stable as a result of our consistently strong operating performance and long-term positive fundamentals.
Key metrics as of December 31, 2021
- $44.0 billion of total market capitalization.
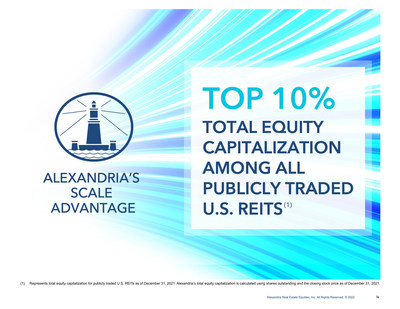
- $35.2 billion of total equity capitalization; represents top 10% in total equity capitalization among all publicly traded U.S. REITs as of December 31, 2021.
- No debt maturities prior to 2024.
- 12.1 years weighted-average remaining term of debt as of December 31, 2021.
4Q21 | Goal | ||||||
Quarter | Trailing | 4Q22 | |||||
Annualized | 12 Months | Annualized | |||||
Net debt and preferred stock to | 5.2x (1) | 5.6x | Less than or equal to 5.1x | ||||
Fixed-charge coverage ratio | 5.3x (1) | 5.0x | Greater than or equal to 5.1x | ||||
(1) | Net debt and preferred stock to adjusted EBITDA and fixed-charge coverage represent the best ratios in the past 10 years. |
Key capital events
- In December 2021, we entered into a new ATM common stock offering program, which allows us to sell up to an aggregate of $1.0 billion of our common stock. As of January 31, 2022, the full amount remains available for future sales of our common stock.
- In December 2021, we settled the outstanding forward equity sales agreements by issuing 4.6 million shares of common stock and received net proceeds of $770.6 million.
- In January 2022, we entered into new forward equity sales agreements aggregating $1.7 billion to sell 8.1 million shares of our common stock (including the exercise of underwriters' option) at a public offering price of $210.00 per share, before underwriting discounts and commissions.
Investments
- As of December 31, 2021, our investments aggregated $1.9 billion, including unrealized gains of $797.7 million.
- Investment income of $259.5 million for the year ended December 31, 2021 included $215.8 million in realized gains and $43.6 million in unrealized gains.
Industry and ESG leadership: catalyzing and leading the way for positive change to benefit human health and society
- In January 2022, Alexandria Venture Investments, our strategic venture capital platform, was recognized by Silicon Valley Bank in its "Healthcare Investments and Exits: 2022 Annual Report" as the #1 most active corporate investor in biopharma by new deal volume (2020-2021) for the fifth consecutive year. Alexandria's venture activity provides us with, among other things, mission-critical data and knowledge on key industry innovations and trends.
- In December 2021, Alexandria established a new social responsibility pillar to address America's growing mental health crisis, with a focus on helping children cope with the loss of a parent or family member to suicide. By partnering with Camp Kita, a tuition-free summer camp for 8- to 17-year-olds who are impacted by the loss of a family member to suicide, we have enabled the non-profit to have long-term access to 28 acres in Acton, Maine that will serve as the camp's future home. The dedicated space will allow Camp Kita to expand its programming, advance its mission, and support the mental health of a community of young survivors.
- As a testament to Alexandria's operational excellence and exceptional team, in November 2021, we were recognized at the 2021 BOMA Boston TOBY (The Outstanding Building of the Year) & Industry Awards for the Laboratory Building of the Year (100 Binney Street) and the Corporate Facility of the Year (200 Technology Square). Five members from our Greater Boston team were also honored for their individual achievements. The TOBY & Industry Awards recognize excellence in property management, building operations, and service in the commercial real estate industry.
- In November 2021, Alexandria's executive chairman and founder, Joel S. Marcus, joined the National Medal of Honor Museum Foundation at the Dallas Cowboys' "Salute to Service" game to support the future National Medal of Honor Museum in Arlington, Texas and its mission to inspire visitors with the stories of our country's Medal of Honor recipients for generations to come. Mr. Marcus has served on the foundation's board of directors since 2019.
- In October 2021, OneFifteen, an innovative, data-driven non-profit evidence-based healthcare ecosystem dedicated to the full and sustained recovery of people living with addiction, celebrated its second anniversary. Since seeing its first patients in October 2019 at its pioneering campus in Dayton, Ohio, which was designed and developed by Alexandria, OneFifteen has treated over 4,000 patients and conducted over 11,500 telehealth visits.
- In October 2021, STEAM:Coders honored Alexandria with the Corporate Vanguard Award, recognizing our longstanding commitment to the non-profit's mission to inspire underrepresented and underserved students and their families through science, technology, engineering, art, and math (STEAM) education in preparation for academic and career opportunities.
Acquisitions | |||||||||||||||||||||||||
Square Footage | |||||||||||||||||||||||||
Acquisitions With Development/Redevelopment Opportunities(1) | |||||||||||||||||||||||||
Property | Submarket/Market | Date of Purchase | Number of | Operating Occupancy | Future | Active | Operating With | Operating(2) | Operating | Total(3) | Purchase Price | ||||||||||||||
Completed in YTD 3Q21 | 76 | 93% | 7,946,121 | 1,434,803 | 2,823,087 | 2,801,041 | 238,948 | 14,272,878 | $ | 3,941,902 | |||||||||||||||
Completed in 4Q21: | |||||||||||||||||||||||||
One Rogers Street | Cambridge/Inner Suburbs/ | 12/30/21 | 1 | 100 (4) | TBD | 403,892 | — | 4,367 | — | 408,259 | 849,422 | ||||||||||||||
1178 El Camino Real | South San Francisco/ | 11/5/21 | — | N/A | 620,000 | — | — | — | — | 620,000 | 128,000 | ||||||||||||||
3420 and 3440 Hillview | Greater Stanford/San | 10/5/21 | 2 | 75 | — | — | 185,228 | — | — | 185,228 | 203,800 | ||||||||||||||
888 Bransten Road | Greater Stanford/San | 11/4/21 | — | N/A | 210,830 | — | — | — | — | 210,830 | 55,000 | ||||||||||||||
Other | Various | Various | 8 | 75 | 1,888,874 | 144,113 | 489,466 | — | 187,512 | 2,709,965 | 291,030 | ||||||||||||||
11 | 75 | 2,719,704 | 548,005 | 674,694 | (5) | 4,367 | (5) | 187,512 | (5) | 4,134,282 | 1,527,252 | ||||||||||||||
2021 acquisitions | 87 | 91% | 10,665,825 | 1,982,808 | 3,497,781 | 2,805,408 | 426,460 | 18,407,160 | $ | 5,469,154 | |||||||||||||||
(1) | We expect to provide total estimated costs and related yields for development and redevelopment projects in the future, subsequent to the commencement of construction. Refer to "New Class A development and redevelopment properties: current projects" in our Supplemental Information for additional details on active development and redevelopment projects. |
(2) | Represents the operating component of our value-creation acquisitions that is not expected to undergo development or redevelopment. |
(3) | Represents total square footage upon completion of development or redevelopment of a new Class A property. Square footage presented includes RSF of buildings currently in operations with future development or redevelopment opportunities. We intend to demolish and develop or to redevelop the existing properties upon expiration of the existing in-place leases. Refer to "Definitions and reconciliations" in our Supplemental Information for additional details on value-creation square feet currently included in rental properties. |
(4) | We pre-leased the entire building by executing leases aggregating 403,892 RSF prior to closing of the acquisition in December 2021. |
(5) | We expect the acquisitions completed during the three months ended December 31, 2021 to generate initial annual net operating income of $14.8 million for the twelve months following acquisition. These acquisitions included 11 operating properties with a weighted-average acquisition date of October 19, 2021 (weighted by initial annual net operating income). |
Acquisitions (continued) | |||||||||||||||||||||||||
Square Footage | |||||||||||||||||||||||||
Acquisitions With Development/Redevelopment Opportunities(1) | |||||||||||||||||||||||||
Property | Submarket/Market | Date of Purchase | Number of | Operating Occupancy | Future | Active | Operating With | Operating(2) | Operating | Total(3) | Purchase | ||||||||||||||
Completed in January 2022: | |||||||||||||||||||||||||
421 Park Drive(4) | Fenway/Greater Boston | 1/13/22 | — | N/A | 202,997 | (4) | — | — | — | — | 202,997 | $ | 81,119 | ||||||||||||
225 and 235 Presidential Way | Route 128/Greater Boston | 1/28/22 | 2 | 100% | — | — | 440,130 | — | — | 440,130 | 124,673 | ||||||||||||||
3301, 3303, 3305, and 3307 Hillview | Greater Stanford/ | 1/6/22 | 4 | 100 | — | — | 292,013 | — | — | 292,013 | 446,000 | ||||||||||||||
Costa Verde by Alexandria | University Town Center/ San Diego | 1/11/22 | 1 | 100 | 537,000 | — | 8,730 | — | — | 545,730 | 125,000 | ||||||||||||||
Alexandria Center® for Life Science – | Research Triangle/Research | 1/11/22 | — | N/A | 1,175,000 | — | — | — | — | 1,175,000 | 99,428 | ||||||||||||||
104 and 108/110/112/114 TW | Research Triangle/Research | 1/6/22 | 4 | 88 | 750,000 | — | 69,484 | — | — | 819,484 | 80,000 | ||||||||||||||
Other | Various | Various | 7 | 92 | 228,250 | — | 428,097 | 381,760 | — | 1,038,107 | 263,620 | ||||||||||||||
18 | 96% | 2,893,247 | — | 1,238,454 | 381,760 | — | 4,513,461 | 1,219,840 | |||||||||||||||||
Pending acquisitions: | |||||||||||||||||||||||||
Mercer Mega Block | Lake Union/Seattle | February | — | N/A | 800,000 | — | — | — | — | 800,000 | 143,500 | ||||||||||||||
Intersection Campus | Texas | February | 9 | 81% | — | — | 998,304 | — | — | 998,304 | 402,000 | ||||||||||||||
545,500 | |||||||||||||||||||||||||
Other targeted acquisitions(6) | 1,234,660 | ||||||||||||||||||||||||
2022 acquisitions (midpoint) | $ | 3,000,000 | |||||||||||||||||||||||
2022 guidance range | $2,500,000 – $3,500,000 | ||||||||||||||||||||||||
(1) | We expect to provide total estimated costs and related yields for development and redevelopment projects in the future, subsequent to the commencement of construction. |
(2) | Represents the operating component of our value-creation acquisitions that is not expected to undergo development or redevelopment. |
(3) | Represents total square footage upon completion of development or redevelopment of a new Class A property. Square footage presented includes RSF of buildings currently in operation with future development or redevelopment opportunities. We intend to demolish and develop or to redevelop the existing properties upon expiration of the existing in-place leases. Refer to "Definitions and reconciliations" in our Supplemental Information for additional details on value-creation square feet currently included in rental properties. |
(4) | Represents the incremental purchase price related to the achievement of additional entitlement rights of 202,997 SF at our Alexandria Center® for Life Science – Fenway mega campus. |
(5) | Represents the acquisition of fee simple interests in the land underlying our recently acquired 108/110/112/114 TW Alexander Drive buildings, which were previously subject to ground leases. |
(6) | Includes a land parcel aggregating 680,000 RSF of future development opportunity at 1150 El Camino Real in our South San Francisco submarket. The property is a transit-oriented opportunity with a BART station located on premises that will combine with other contiguous land that was recently acquired, including 1122 and 1178 El Camino Real, to create a new mega campus consisting of 2.0 million RSF of future development opportunities. |
Dispositions and Sales of Partial Interest | |||||||||||||||||||||||||
Property | Submarket/Market | Date of | Interest | RSF | Capitalization | Capitalization (Cash Basis) | Sales Price(1) | Sales Price | Gain or | ||||||||||||||||
Completed in YTD 3Q21 | 1,011,263 | $ 663,283 | $ 201,490 | ||||||||||||||||||||||
Completed in 4Q21: | |||||||||||||||||||||||||
50 and 60 Binney Street | Cambridge/Inner Suburbs/ | 12/15/21 | 66% | 532,395 | 4.3% | 3.9% | 782,259 | $ 2,226 | 457,529 | (3) | |||||||||||||||
409 and 499 Illinois Street | Mission Bay/San Francisco Bay Area | 10/5/21 | 35% | (2) | 455,069 | 5.0% | 4.2% | 274,681 | $ 1,366 | 113,756 | (3) | ||||||||||||||
1500 Owens Street | Mission Bay/San Francisco Bay Area | 25.1% | (2) | 158,267 | |||||||||||||||||||||
455 Mission Bay Boulevard | Mission Bay/San Francisco Bay Area | 12/16/21 | 75% | 228,140 | 4.1% | 3.8% | 381,355 | $ 1,295 | 221,868 | (3) | |||||||||||||||
1700 Owens Street | Mission Bay/San Francisco Bay Area | 164,513 | |||||||||||||||||||||||
Menlo Gateway | Greater Stanford/San Francisco Bay | 12/21/21 | (4) | 772,983 | 5.4% | 5.1% | 397,851 | (5) | $ 1,430 | 101,050 | (6) | ||||||||||||||
2301 5th Avenue | Lake Union/Seattle | 12/22/21 | 100% | 197,135 | 6.3% | 4.9% | 118,707 | $ 602 | 23,175 | (6) | |||||||||||||||
Other | Various | Various | 100% | 79,007 | N/A | N/A | 12,000 | N/A | — | ||||||||||||||||
2,587,509 | 1,966,853 | 917,378 | |||||||||||||||||||||||
2021 dispositions and sales of partial interest | 3,598,772 | $ 2,630,136 | (7) | $ 1,118,868 | (8) | ||||||||||||||||||||
(1) | For sales of partial interests; represents the contractual sales price for the percentage interest of the property sold by us. |
(2) | We recapitalized these consolidated real estate joint ventures and sold: (i) a 35% interest in 409 and 499 Illinois Street and (ii) a 25.1% interest in 1500 Owens Street, resulting in an acquisition by the investor of a 75% ownership interest in each joint venture, including the interest held by our previous joint venture partners. |
(3) | For each partial interest sale, we retained control over the newly formed real estate joint venture and therefore continued to consolidate this property. We accounted for the difference between the consideration received and the book value of the interest sold as an equity transaction, with no gain or loss recognized in earnings. |
(4) | We sold our 49.0% interest in Menlo Gateway, which represents our entire equity interest in the unconsolidated real estate joint venture. |
(5) | Represents a sales price of $541.5 million less our share of the debt held by the unconsolidated real estate joint venture assumed by the buyer aggregating $143.6 million. |
(6) | We sold our entire interest in this property and recognized the related gain in earnings, classified within gain (loss) on sales of real estate in our consolidated statements of operations. |
(7) | Represents the highest total volume of dispositions in Company history, at a weighted-average capitalization rate (cash basis) of 4.1%. |
(8) | We achieved a weighted-average value-creation margin of 75% on our completed dispositions and sales of partial interest. |
Dispositions and Sales of Partial Interest (continued) | ||||||||||||||
Property | Market | Date of | Interest | RSF | Sales Price | |||||||||
Partial interest sale | Greater Boston | 1Q22 | TBD | TBD | $ 650,000 | – | $ 750,000 | |||||||
Other real estate dispositions and partial interest sales | 1Q22 | TBD | TBD | 50,000 | – | 150,000 | ||||||||
Other targeted real estate dispositions and partial interest sales | 600,000 | – | 1,200,000 | |||||||||||
2022 guidance range | $ 1,300,000 | – | $ 2,100,000 | |||||||||||
Guidance | ||
The following guidance is based on our current view of existing market conditions and assumptions for the year ending December 31, 2022. There can be no assurance that actual amounts will not be materially higher or lower than these expectations. Also, refer to our discussion of "forward-looking statements" on page 9 of this Earnings Press Release for additional details. | ||
Projected 2022 Earnings per Share and Funds From Operations per Share Attributable to | ||
Earnings per share(1) | $2.65 to $2.85 | |
Depreciation and amortization of real estate assets | 5.65 | |
Allocation to unvested restricted stock awards | (0.04) | |
Funds from operations per share(2) | $8.26 to $8.46 | |
Midpoint | $8.36 | |
Key Assumptions | Low | High | |||
Occupancy percentage in North America as of December 31, 2022 | 95.2% | 95.8% | |||
Lease renewals and re-leasing of space: | |||||
Rental rate increases | 30.0% | 35.0% | |||
Rental rate increases (cash basis) | 18.0% | 23.0% | |||
Same property performance: | |||||
Net operating income increase | 5.5% | 7.5% | |||
Net operating income increase (cash basis) | 6.5% | 8.5% | |||
Straight-line rent revenue | $ 150 | $ 160 | |||
General and administrative expenses | $ 168 | $ 176 | |||
Capitalization of interest | $ 269 | $ 279 | |||
Interest expense | $ 90 | $ 100 | |||
Key Credit Metrics | 2022 Guidance | |
Net debt and preferred stock to Adjusted EBITDA – 4Q22 annualized | Less than or equal to 5.1x | |
Fixed-charge coverage ratio – 4Q22 annualized | Greater than or equal to 5.1x | |
Key Sources and Uses of Capital | Range | Midpoint | Certain Completed | |||||||
Sources of capital: | ||||||||||
Net cash provided by operating activities after | $ 275 | $ 325 | $ | 300 | ||||||
Incremental debt | 1,375 | 1,025 | 1,200 | |||||||
Real estate dispositions and partial interest sales | 1,300 | 2,100 | 1,700 | |||||||
Common equity | 2,250 | 3,250 | 2,750 | $ 1,691 | ||||||
Total sources of capital | $ 5,200 | $ 6,700 | $ | 5,950 | ||||||
Uses of capital: | ||||||||||
Construction | $ 2,700 | $ 3,200 | $ | 2,950 | ||||||
Acquisitions (refer to page 5) | 2,500 | 3,500 | 3,000 | $ 1,220 | ||||||
Total uses of capital | $ 5,200 | $ 6,700 | $ | 5,950 | ||||||
Incremental debt (included above): | ||||||||||
Issuance of unsecured senior notes payable | $ 1,200 | $ 1,700 | $ | 1,450 | ||||||
Unsecured senior line of credit, commercial paper, | 175 | (675) | (250) | |||||||
Incremental debt | $ 1,375 | $ 1,025 | $ | 1,200 | ||||||
(1) | Excludes unrealized gains or losses after December 31, 2021 that are required to be recognized in earnings and are excluded from funds from operations per share, as adjusted. |
(2) | Refer to "Funds from operations and funds from operations, as adjusted, attributable to Alexandria's common stockholders" in the "Definitions and reconciliations" of our Supplemental Information for additional details. |
Earnings Call Information and About the Company
December 31, 2021
We will host a conference call on Tuesday, February 1, 2022, at 3:00 p.m. Eastern Time ("ET")/noon Pacific Time ("PT"), which is open to the general public, to discuss our financial and operating results for the fourth quarter and year ended December 31, 2021. To participate in this conference call, dial (833) 366-1125 or (412) 902-6738 shortly before 3:00 p.m. ET/noon PT and ask the operator to join the call for Alexandria Real Estate Equities, Inc. The audio webcast can be accessed at www.are.com in the "For Investors" section. A replay of the call will be available for a limited time from 5:00 p.m. ET/2:00 p.m. PT on Tuesday, February 1, 2022. The replay number is (877) 344-7529 or (412) 317-0088, and the access code is 10161869.
Additionally, a copy of this Earnings Press Release and Supplemental Information for the fourth quarter and year ended December 31, 2021, is available in the "For Investors" section of our website at www.are.com or by following this link: http://www.are.com/fs/2021q4.pdf.
For any questions, please contact Joel S. Marcus, executive chairman and founder; Stephen A. Richardson, co-chief executive officer; Peter M. Moglia, co-chief executive officer and co-chief investment officer; Dean A. Shigenaga, president and chief financial officer; Paula Schwartz, managing director of Rx Communications Group, at (917) 322-2216; or Sara M. Kabakoff, vice president – communications, at (626) 578-0777.
About the Company
Alexandria Real Estate Equities, Inc. (NYSE:ARE), an S&P 500® urban office real estate investment trust ("REIT"), is the first, longest-tenured, and pioneering owner, operator, and developer uniquely focused on collaborative life science, agtech, and technology campuses in AAA innovation cluster locations, with a total market capitalization of $44.0 billion as of December 31, 2021, and an asset base in North America of 67.0 million square feet ("SF"). The asset base in North America includes 38.8 million RSF of operating properties and 4.8 million RSF of Class A properties undergoing construction, 8.7 million RSF of near-term and intermediate-term development and redevelopment projects, and 14.7 million SF of future development projects. Founded in 1994, Alexandria pioneered this niche and has since established a significant market presence in key locations, including Greater Boston, the San Francisco Bay Area, New York City, San Diego, Seattle, Maryland, and Research Triangle. Alexandria has a longstanding and proven track record of developing Class A properties clustered in urban life science, agtech, and technology campuses that provide our innovative tenants with highly dynamic and collaborative environments that enhance their ability to successfully recruit and retain world-class talent and inspire productivity, efficiency, creativity, and success. Alexandria also provides strategic capital to transformative life science, agtech, and technology companies through our venture capital platform. We believe our unique business model and diligent underwriting ensure a high-quality and diverse tenant base that results in higher occupancy levels, longer lease terms, higher rental income, higher returns, and greater long-term asset value. For additional information on Alexandria, please visit www.are.com.
***********
This document includes "forward-looking statements" within the meaning of Section 27A of the Securities Act of 1933, as amended, and Section 21E of the Securities Exchange Act of 1934, as amended. Such forward-looking statements include, without limitation, statements regarding our 2022 earnings per share attributable to Alexandria's common stockholders – diluted, 2022 funds from operations per share attributable to Alexandria's common stockholders – diluted, net operating income, and our projected sources and uses of capital. You can identify the forward-looking statements by their use of forward-looking words, such as "forecast," "guidance," "goals," "projects," "estimates," "anticipates," "believes," "expects," "intends," "may," "plans," "seeks," "should," "targets," or "will," or the negative of those words or similar words. These forward-looking statements are based on our current expectations, beliefs, projections, future plans and strategies, anticipated events or trends, and similar expressions concerning matters that are not historical facts, as well as a number of assumptions concerning future events. There can be no assurance that actual results will not be materially higher or lower than these expectations. These statements are subject to risks, uncertainties, assumptions, and other important factors that could cause actual results to differ materially from the results discussed in the forward-looking statements. Factors that might cause such a difference include, without limitation, our failure to obtain capital (debt, construction financing, and/or equity) or refinance debt maturities, lower than expected yields, increased interest rates and operating costs, adverse economic or real estate developments in our markets, our failure to successfully place into service and lease any properties undergoing development or redevelopment and our existing space held for future development or redevelopment (including new properties acquired for that purpose), our failure to successfully operate or lease acquired properties, decreased rental rates, increased vacancy rates or failure to renew or replace expiring leases, defaults on or non-renewal of leases by tenants, adverse general and local economic conditions, an unfavorable capital market environment, decreased leasing activity or lease renewals, failure to obtain LEED and other healthy building certifications and efficiencies, and other risks and uncertainties detailed in our filings with the Securities and Exchange Commission ("SEC"). Accordingly, you are cautioned not to place undue reliance on such forward-looking statements. All forward-looking statements are made as of the date of this Earnings Press Release and Supplemental Information, and unless otherwise stated, we assume no obligation to update this information and expressly disclaim any obligation to update or revise any forward-looking statements, whether as a result of new information, future events, or otherwise. For more discussion relating to risks and uncertainties that could cause actual results to differ materially from those anticipated in our forward-looking statements, and risks to our business in general, please refer to our SEC filings, including our most recent annual report on Form 10-K and any subsequent quarterly reports on Form 10-Q.
Alexandria®, Lighthouse Design® logo, Building the Future of Life-Changing Innovation™, That's What's in Our DNA®, Labspace®, Alexandria Center®, Alexandria Technology Square®, Alexandria Technology Center®, and Alexandria Innovation Center® are copyrights and trademarks of Alexandria Real Estate Equities, Inc. All other company names, trademarks, and logos referenced herein are the property of their respective owners.
Consolidated Statements of Operations | ||||||||||||||
Three Months Ended | Year Ended | |||||||||||||
12/31/21 | 9/30/21 | 6/30/21 | 3/31/21 | 12/31/20 | 12/31/21 | 12/31/20 | ||||||||
Revenues: | ||||||||||||||
Income from rentals | $ 574,656 | $ 546,527 | $ 508,371 | $ 478,695 | $ 461,335 | $ 2,108,249 | $ 1,878,208 | |||||||
Other income | 2,267 | 1,232 | 1,248 | 1,154 | 2,385 | 5,901 | 7,429 | |||||||
Total revenues | 576,923 | 547,759 | 509,619 | 479,849 | 463,720 | 2,114,150 | 1,885,637 | |||||||
Expenses: | ||||||||||||||
Rental operations | 175,717 | 165,995 | 143,955 | 137,888 | 136,767 | 623,555 | 530,224 | |||||||
General and administrative | 41,654 | 37,931 | 37,880 | 33,996 | 32,690 | 151,461 | 133,341 | |||||||
Interest | 34,862 | 35,678 | 35,158 | 36,467 | 37,538 | 142,165 | 171,609 | |||||||
Depreciation and amortization | 239,254 | 210,842 | 190,052 | 180,913 | 177,750 | 821,061 | 698,104 | |||||||
Impairment of real estate | — | 42,620 | 4,926 | 5,129 | 25,177 | 52,675 | 48,078 | |||||||
Loss on early extinguishment of debt | — | — | — | 67,253 | 7,898 | 67,253 | 60,668 | |||||||
Total expenses | 491,487 | 493,066 | 411,971 | 461,646 | 417,820 | 1,858,170 | 1,642,024 | |||||||
Equity in earnings of unconsolidated real estate joint ventures | 3,018 | 3,091 | 2,609 | 3,537 | 3,593 | 12,255 | 8,148 | |||||||
Investment (loss) income | (112,884) | 67,084 | 304,263 | 1,014 | 255,137 | 259,477 | 421,321 | |||||||
Gain (loss) on sales of real estate | 124,226 | (1) | (435) | — | 2,779 | 152,503 | 126,570 | (1) | 154,089 | |||||
Net income | 99,796 | 124,433 | 404,520 | 25,533 | 457,133 | 654,282 | 827,171 | |||||||
Net income attributable to noncontrolling interests | (24,901) | (21,286) | (19,436) | (17,412) | (15,649) | (83,035) | (56,212) | |||||||
Net income attributable to Alexandria Real Estate Equities, Inc.'s | 74,895 | 103,147 | 385,084 | 8,121 | 441,484 | 571,247 | 770,959 | |||||||
Net income attributable to unvested restricted stock awards | (2,098) | (1,883) | (4,521) | (2,014) | (5,561) | (7,848) | (10,168) | |||||||
Net income attributable to Alexandria Real Estate Equities, Inc.'s common | $ 72,797 | $ 101,264 | $ 380,563 | $ 6,107 | $ 435,923 | $ 563,399 | $ 760,791 | |||||||
Net income per share attributable to Alexandria Real Estate Equities, Inc.'s | ||||||||||||||
Basic | $ 0.47 | $ 0.67 | $ 2.61 | $ 0.04 | $ 3.26 | $ 3.83 | $ 6.03 | |||||||
Diluted | $ 0.47 | $ 0.67 | $ 2.61 | $ 0.04 | $ 3.26 | $ 3.82 | $ 6.01 | |||||||
Weighted-average shares of common stock outstanding: | ||||||||||||||
Basic | 153,464 | 150,854 | 145,825 | 137,319 | 133,688 | 146,921 | 126,106 | |||||||
Diluted | 154,307 | 151,561 | 146,058 | 137,688 | 133,827 | 147,460 | 126,490 | |||||||
Dividends declared per share of common stock | $ 1.15 | $ 1.12 | $ 1.12 | $ 1.09 | $ 1.09 | $ 4.48 | $ 4.24 | |||||||
(1) | Refer to "Funds from operations and funds from operations per share" of this Earnings Press Release for additional details. |
Consolidated Balance Sheets | ||||||||||
12/31/21 | 9/30/21 | 6/30/21 | 3/31/21 | 12/31/20 | ||||||
Assets | ||||||||||
Investments in real estate | $ 24,980,669 | $ 23,071,514 | $ 21,692,385 | $ 20,253,418 | $ 18,092,372 | |||||
Investments in unconsolidated real estate joint ventures | 38,483 | 321,737 | 323,622 | 325,928 | 332,349 | |||||
Cash and cash equivalents | 361,348 | 325,872 | 323,876 | 492,184 | 568,532 | |||||
Restricted cash | 53,879 | 42,182 | 33,697 | 42,219 | 29,173 | |||||
Tenant receivables | 7,379 | 7,749 | 6,710 | 7,556 | 7,333 | |||||
Deferred rent | 839,335 | 816,219 | 781,600 | 751,967 | 722,751 | |||||
Deferred leasing costs | 402,898 | 329,952 | 321,005 | 294,328 | 272,673 | |||||
Investments | 1,876,564 | 2,046,878 | 1,999,283 | 1,641,811 | 1,611,114 | |||||
Other assets | 1,658,818 | 1,596,615 | 1,536,672 | 1,424,935 | 1,191,581 | |||||
Total assets | $ 30,219,373 | $ 28,558,718 | $ 27,018,850 | $ 25,234,346 | $ 22,827,878 | |||||
Liabilities, Noncontrolling Interests, and Equity | ||||||||||
Secured notes payable | $ 205,198 | $ 198,758 | $ 227,984 | $ 229,406 | $ 230,925 | |||||
Unsecured senior notes payable | 8,316,678 | 8,314,851 | 8,313,025 | 8,311,512 | 7,232,370 | |||||
Unsecured senior line of credit and commercial paper | 269,990 | 749,978 | 299,990 | — | 99,991 | |||||
Accounts payable, accrued expenses, and other liabilities | 2,210,410 | 2,149,450 | 1,825,387 | 1,750,687 | 1,669,832 | |||||
Dividends payable | 183,847 | 173,560 | 170,647 | 160,779 | 150,982 | |||||
Total liabilities | 11,186,123 | 11,586,597 | 10,837,033 | 10,452,384 | 9,384,100 | |||||
Commitments and contingencies | ||||||||||
Redeemable noncontrolling interests | 9,612 | 11,681 | 11,567 | 11,454 | 11,342 | |||||
Alexandria Real Estate Equities, Inc.'s stockholders' equity: | ||||||||||
Common stock | 1,580 | 1,532 | 1,507 | 1,457 | 1,367 | |||||
Additional paid-in capital | 16,195,256 | 14,727,735 | 14,194,023 | 12,994,748 | 11,730,970 | |||||
Accumulated other comprehensive loss | (7,294) | (6,029) | (4,508) | (5,799) | (6,625) | |||||
Alexandria Real Estate Equities, Inc.'s stockholders' equity | 16,189,542 | 14,723,238 | 14,191,022 | 12,990,406 | 11,725,712 | |||||
Noncontrolling interests | 2,834,096 | 2,237,202 | 1,979,228 | 1,780,102 | 1,706,724 | |||||
Total equity | 19,023,638 | 16,960,440 | 16,170,250 | 14,770,508 | 13,432,436 | |||||
Total liabilities, noncontrolling interests, and equity | $ 30,219,373 | $ 28,558,718 | $ 27,018,850 | $ 25,234,346 | $ 22,827,878 | |||||
Funds From Operations and Funds From Operations per Share | ||||||||||||||
The following table presents a reconciliation of net income (loss) attributable to Alexandria's common stockholders, the most directly comparable financial measure presented in accordance with U.S. generally accepted accounting principles ("GAAP"), including our share of amounts from consolidated and unconsolidated real estate joint ventures, to funds from operations attributable to Alexandria's common stockholders – diluted, and funds from operations attributable to Alexandria's common stockholders – diluted, as adjusted, for the periods below: | ||||||||||||||
Three Months Ended | Year Ended | |||||||||||||
12/31/21 | 9/30/21 | 6/30/21 | 3/31/21 | 12/31/20 | 12/31/21 | 12/31/20 | ||||||||
Net income attributable to Alexandria's common stockholders | $ 72,797 | $ 101,264 | $ 380,563 | $ 6,107 | $ 435,923 | $ 563,399 | $ 760,791 | |||||||
Depreciation and amortization of real estate assets | 234,979 | 205,436 | 186,498 | 177,720 | 173,392 | 804,633 | 684,682 | |||||||
Noncontrolling share of depreciation and amortization from consolidated real | (21,265) | (17,871) | (16,301) | (15,443) | (15,032) | (70,880) | (61,933) | |||||||
Our share of depreciation and amortization from unconsolidated real estate JVs | 3,058 | 3,465 | 4,135 | 3,076 | 2,976 | 13,734 | 11,413 | |||||||
(Gain) loss on sales of real estate | (124,226) | (1) | 435 | — | (2,779) | (152,503) | (126,570) | (1) | (154,089) | |||||
Impairment of real estate – rental properties | — | 18,602 | 1,754 | 5,129 | 25,177 | 25,485 | 40,501 | |||||||
Allocation to unvested restricted stock awards | — | (1,472) | (2,191) | (201) | (420) | (6,315) | (7,018) | |||||||
Funds from operations attributable to Alexandria's common stockholders – | 165,343 | 309,859 | 554,458 | 173,609 | 469,513 | 1,203,486 | 1,274,347 | |||||||
Unrealized losses (gains) on non-real estate investments | 139,716 | 14,432 | (244,031) | 46,251 | (233,538) | (43,632) | (374,033) | |||||||
Significant realized gains on non-real estate investments | — | (52,427) | (34,773) | (22,919) | — | (110,119) | — | |||||||
Impairment of non-real estate investments | — | — | — | — | — | — | 24,482 | |||||||
Impairment of real estate | — | 24,018 | 3,172 | — | — | 27,190 | 15,221 | |||||||
Loss on early extinguishment of debt | — | — | — | 67,253 | 7,898 | 67,253 | 60,668 | |||||||
Termination fee | — | — | — | — | — | — | (86,179) | |||||||
Acceleration of stock compensation expense due to executive officer resignation | — | — | — | — | — | — | 4,499 | |||||||
Allocation to unvested restricted stock awards | (1,432) | 149 | 3,428 | (1,208) | 2,774 | 710 | 4,790 | |||||||
Funds from operations attributable to Alexandria's common stockholders – | $ 303,627 | $ 296,031 | $ 282,254 | $ 262,986 | $ 246,647 | $ 1,144,888 | $ 923,795 | |||||||
(1) | Includes $101.1 million related to the sale of our entire 49.0% interest in the unconsolidated real estate joint venture at Menlo Gateway. |
(2) | Calculated in accordance with standards established by the Nareit Board of Governors. |
Funds From Operations and Funds From Operations per Share (continued) | ||||||||||||||
The following table presents a reconciliation of net income (loss) per share attributable to Alexandria's common stockholders, the most directly comparable financial measure presented in accordance with GAAP, including our share of amounts from consolidated and unconsolidated real estate joint ventures, to funds from operations per share attributable to Alexandria's common stockholders – diluted, and funds from operations per share attributable to Alexandria's common stockholders – diluted, as adjusted, for the periods below. Per share amounts may not add due to rounding. | ||||||||||||||
Three Months Ended | Year Ended | |||||||||||||
12/31/21 | 9/30/21 | 6/30/21 | 3/31/21 | 12/31/20 | 12/31/21 | 12/31/20 | ||||||||
Net income per share attributable to Alexandria's common stockholders – | $ 0.47 | $ 0.67 | $ 2.61 | $ 0.04 | $ 3.26 | $ 3.82 | $ 6.01 | |||||||
Depreciation and amortization of real estate assets | 1.40 | 1.26 | 1.19 | 1.20 | 1.21 | 5.07 | 5.01 | |||||||
(Gain) loss on sales of real estate | (0.80) | — | — | (0.02) | (1.14) | (0.86) | (1.22) | |||||||
Impairment of real estate – rental properties | — | 0.12 | 0.01 | 0.04 | 0.19 | 0.17 | 0.32 | |||||||
Allocation to unvested restricted stock awards | — | (0.01) | (0.01) | — | (0.01) | (0.04) | (0.05) | |||||||
Funds from operations per share attributable to Alexandria's common | 1.07 | 2.04 | 3.80 | 1.26 | 3.51 | 8.16 | 10.07 | |||||||
Unrealized losses (gains) on non-real estate investments | 0.91 | 0.10 | (1.67) | 0.34 | (1.75) | (0.30) | (2.96) | |||||||
Significant realized gains on non-real estate investments | — | (0.35) | (0.24) | (0.17) | — | (0.75) | — | |||||||
Impairment of non-real estate investments | — | — | — | — | — | — | 0.19 | |||||||
Impairment of real estate | — | 0.16 | 0.02 | — | — | 0.18 | 0.12 | |||||||
Loss on early extinguishment of debt | — | — | — | 0.49 | 0.06 | 0.46 | 0.48 | |||||||
Termination fee | — | — | — | — | — | — | (0.68) | |||||||
Acceleration of stock compensation expense due to executive officer resignation | — | — | — | — | — | — | 0.04 | |||||||
Allocation to unvested restricted stock awards | (0.01) | — | 0.02 | (0.01) | 0.02 | 0.01 | 0.04 | |||||||
Funds from operations per share attributable to Alexandria's common | $ 1.97 | $ 1.95 | $ 1.93 | $ 1.91 | $ 1.84 | $ 7.76 | $ 7.30 | |||||||
Weighted-average shares of common stock outstanding – diluted | 154,307 | 151,561 | 146,058 | 137,688 | 133,827 | 147,460 | 126,490 | |||||||
SOURCE Alexandria Real Estate Equities, Inc.
