Mutual Funds
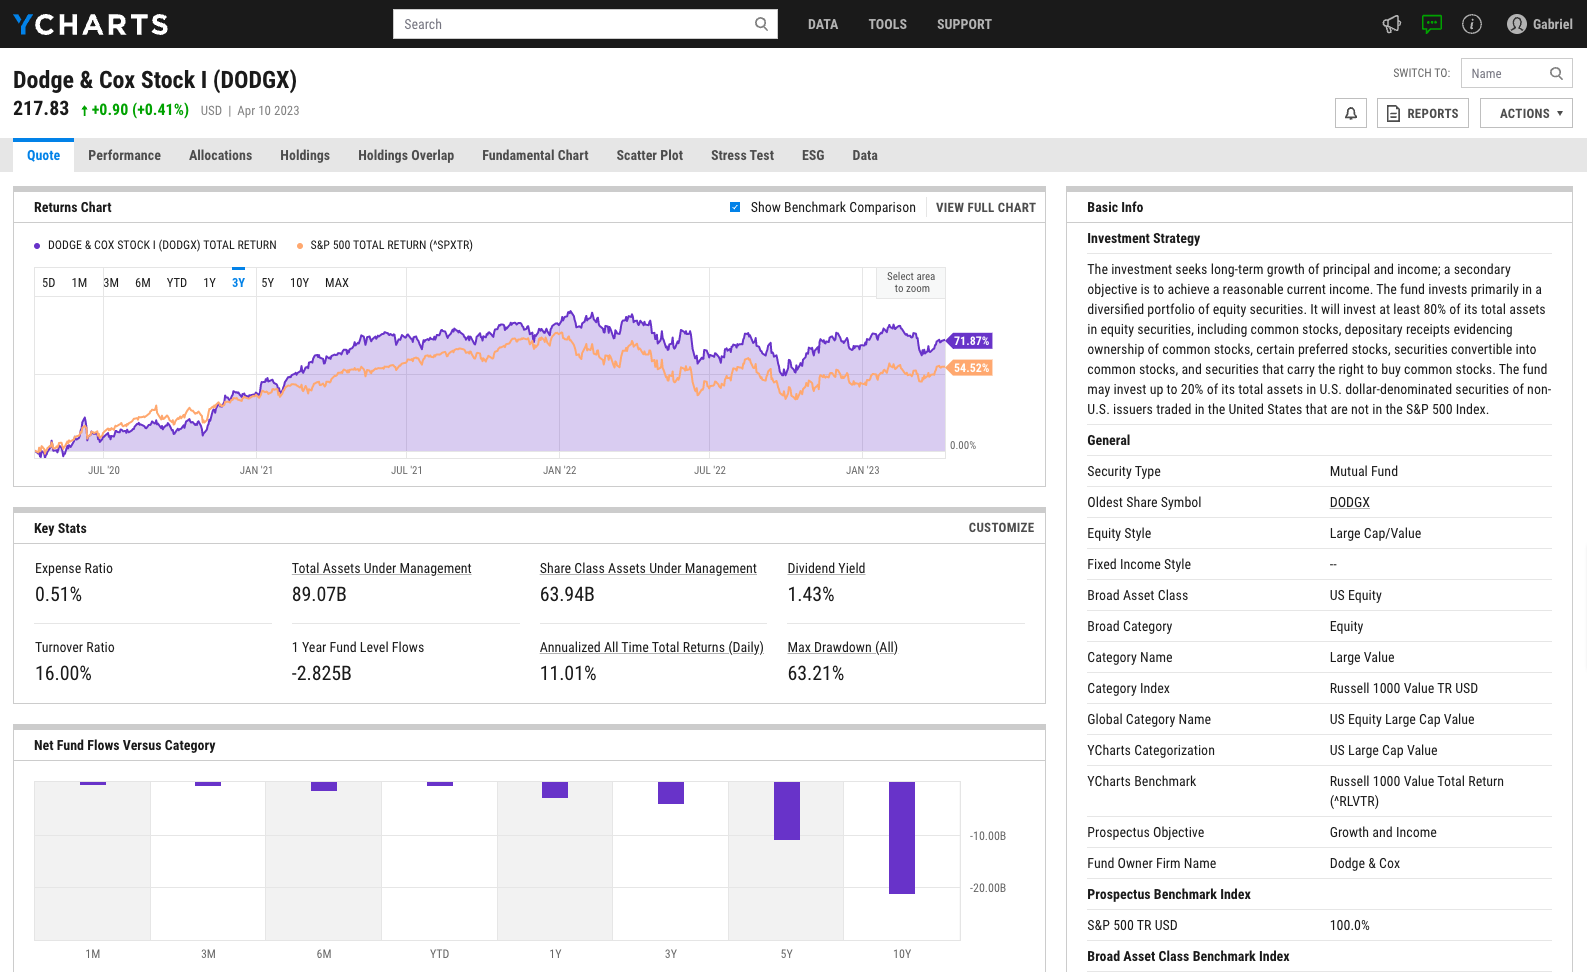
A universe of 45,000+ funds, plus CEFs and UITs, including asset flows, manager info, brokerage availability, category rankings, and more.

QUESTIONS?
- Email: support@ycharts.com
- Call: (866) 965-7552
READY TO GET STARTED?
Unlock My AccessAccess US Mutual Fund Data Now
Unlock access to US Mutual Fund Data by registering below. No credit card required.
Unlock My AccessQUESTIONS?
- Email: support@ycharts.com
- Call: (866) 965-7552