RBC O'Shaughnessy U.S. Growth Fund II A (RBF306)
8.424
+0.01 (+0.14%)
CAD |
Jan 27 2023
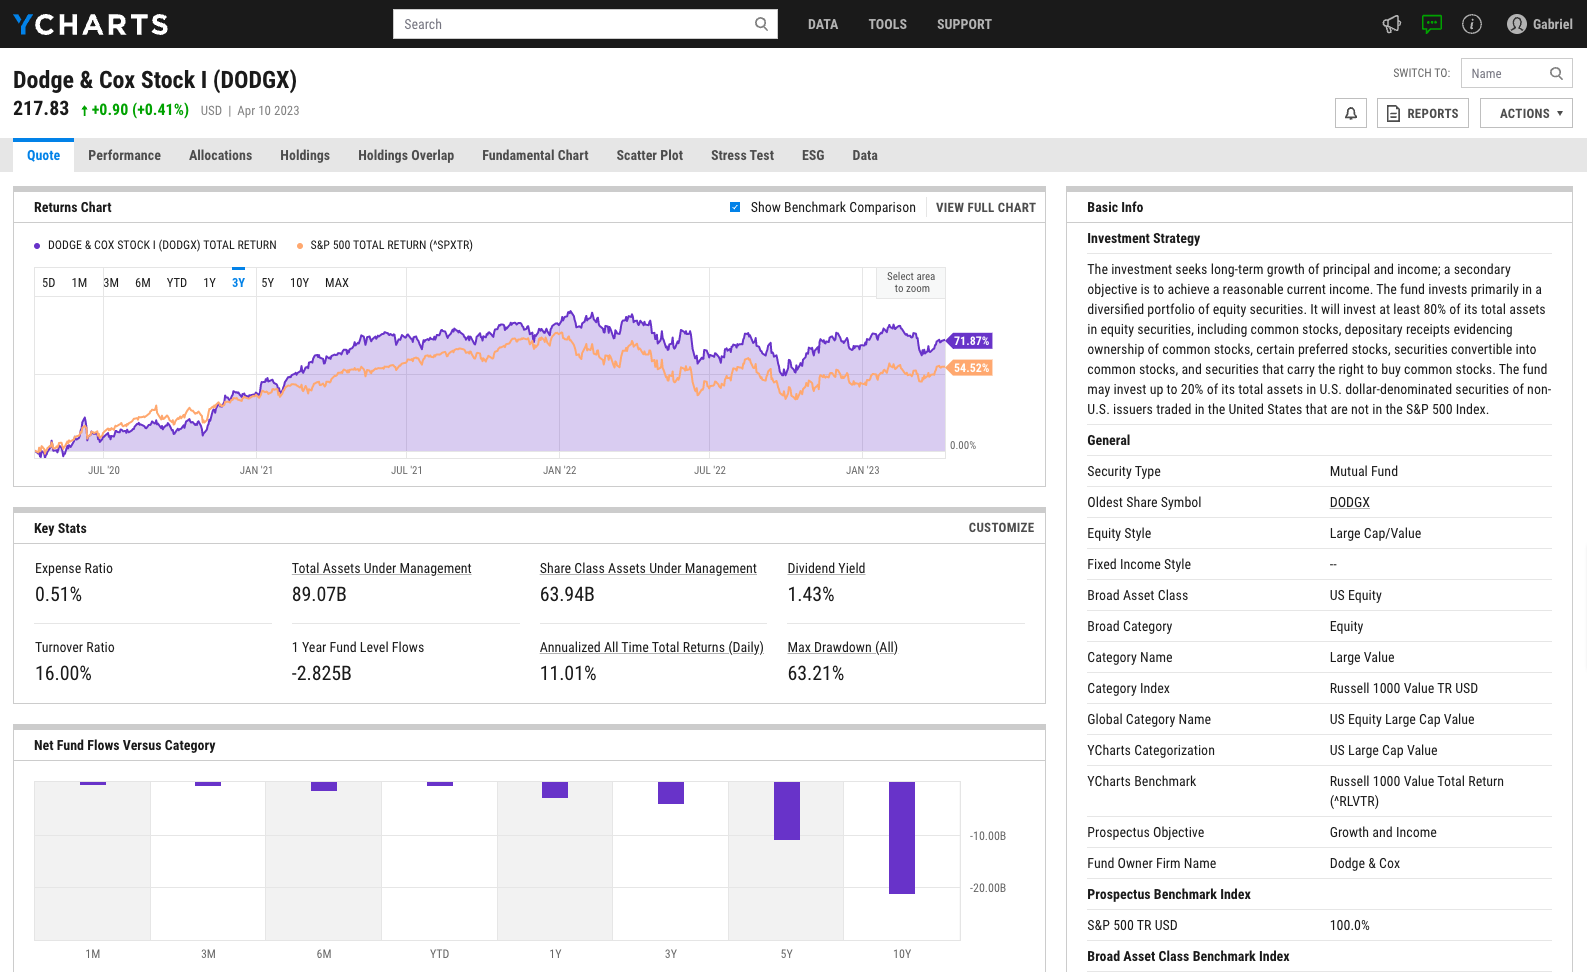
Returns Chart
Key Stats
Customize
Expense Ratio | Total Assets Under Management | Dividend Yield | Turnover Ratio |
---|---|---|---|
2.15% | 18.62M | 0.00% | 81.65% |
1 Year Fund Level Flows | 1 Year Total Returns (Daily) | Annualized All Time Total Returns (Daily) | Max Drawdown (All) |
-1.722M | -1.23% | Upgrade | Upgrade |
Basic Info
Investment Strategy | |
To provide long-term capital growth by investing primarily in equity securities of U.S. companies based on Strategy Indexing®, a rigorous and disciplined approach to stock selection based on characteristics associated with above-average returns over long periods of time. |
General | |
Security Type | Mutual Fund |
Oldest Share Symbol | RBF655 |
Equity Style | Small Cap/Growth |
Fixed Income Style | -- |
Broad Asset Class | -- |
Broad Category | Equity |
Category Name | US Small/Mid Cap Equity |
Category Index | Morningstar US SMID TR CAD |
Global Category Name | US Equity Mid Cap |
YCharts Categorization | US Mid Cap |
YCharts Benchmark | Russell Midcap Total Return (^RMCTR) |
Prospectus Objective | -- |
Fund Owner Firm Name | RBC Global Asset Management Inc. |
Prospectus Benchmark Index | |
Russell 2500 Growth TR USD | 100.0% |
Broad Asset Class Benchmark Index | |
^SPTSX60TR | 100.0% |
Manager Tenure | |
Jim O'Shaughnessy | 14.97 yrs |
Patrick O'Shaughnessy | 4.92 yrs |
Net Fund Flows Versus Category
1 Month
% Rank:
--
--
Category Low
--
Category High
1 Year
% Rank:
45
-1.722M
-594.95M
Category Low
426.15M
Category High
3 Months
% Rank:
--
--
Category Low
--
Category High
3 Years
% Rank:
--
--
Category Low
--
Category High
6 Months
% Rank:
--
--
Category Low
--
Category High
5 Years
% Rank:
--
--
Category Low
--
Category High
YTD
% Rank:
--
--
Category Low
--
Category High
10 Years
% Rank:
--
--
Category Low
--
Category High
As of December 31, 2022
Performance Versus Category
As of January 27, 2023. Returns for periods of 1 year and above are annualized.
Annual Total Returns Versus Peers
As of January 27, 2023.
Asset Allocation
Top 10 Holdings
Name | % Weight | Price | % Change |
---|---|---|---|
Bank Of Nova Scotia Utd 4.450% Jan 03, 2023
|
1.35% | -- | -- |
Fair Isaac Corp | 1.23% | 660.25 | 2.20% |
Jabil Inc
|
1.02% | -- | -- |
Bio-Techne Corp | 1.01% | 81.19 | 1.08% |
LPL Financial Holdings Inc | 0.98% | 232.00 | -0.10% |
PTC Inc | 0.91% | 135.09 | -0.50% |
Texas Pacific Land Corp | 0.83% | 2046.62 | -2.17% |
Booz Allen Hamilton Holding Corp Class A | 0.78% | 92.73 | -4.58% |
Tetra Tech Inc | 0.77% | 153.88 | 0.05% |
Lattice Semiconductor Corp | 0.73% | 75.59 | -1.77% |
Basic Info
Investment Strategy | |
To provide long-term capital growth by investing primarily in equity securities of U.S. companies based on Strategy Indexing®, a rigorous and disciplined approach to stock selection based on characteristics associated with above-average returns over long periods of time. |
General | |
Security Type | Mutual Fund |
Oldest Share Symbol | RBF655 |
Equity Style | Small Cap/Growth |
Fixed Income Style | -- |
Broad Asset Class | -- |
Broad Category | Equity |
Category Name | US Small/Mid Cap Equity |
Category Index | Morningstar US SMID TR CAD |
Global Category Name | US Equity Mid Cap |
YCharts Categorization | US Mid Cap |
YCharts Benchmark | Russell Midcap Total Return (^RMCTR) |
Prospectus Objective | -- |
Fund Owner Firm Name | RBC Global Asset Management Inc. |
Prospectus Benchmark Index | |
Russell 2500 Growth TR USD | 100.0% |
Broad Asset Class Benchmark Index | |
^SPTSX60TR | 100.0% |
Manager Tenure | |
Jim O'Shaughnessy | 14.97 yrs |
Patrick O'Shaughnessy | 4.92 yrs |
Fundamentals
General | |
Distribution Yield | Upgrade |
Dividend Yield TTM (1-27-23) | 0.00% |
30-Day SEC Yield | -- |
7-Day SEC Yield | -- |
Number of Holdings | Upgrade |
Stock | |
Weighted Average PE Ratio | 14.43 |
Weighted Average Price to Sales Ratio | Upgrade |
Weighted Average Price to Book Ratio | Upgrade |
Weighted Median ROE | Upgrade |
Weighted Median ROA | Upgrade |
Forecasted Dividend Yield | Upgrade |
Forecasted PE Ratio | Upgrade |
Forecasted Price to Sales Ratio | Upgrade |
Forecasted Price to Book Ratio | Upgrade |
As of December 31, 2022
Growth Estimates
Fund Details
Key Dates | |
Inception Date | 1/14/2008 |
Last Annual Report Date | 12/31/2021 |
Last Prospectus Date | -- |
Share Classes | |
RBF1046 | Do-It-Yourself |
RBF655 | Fee-based Advice |
Attributes | |
Index Fund | No |
Inverse Fund | No |
Leveraged Fund | No |
Fund of Funds | No |
Currency Hedged Fund | No |
Synthetic Replication Fund | No |
Has Dividend Investment Plan | No |
Socially Responsible Fund | No |