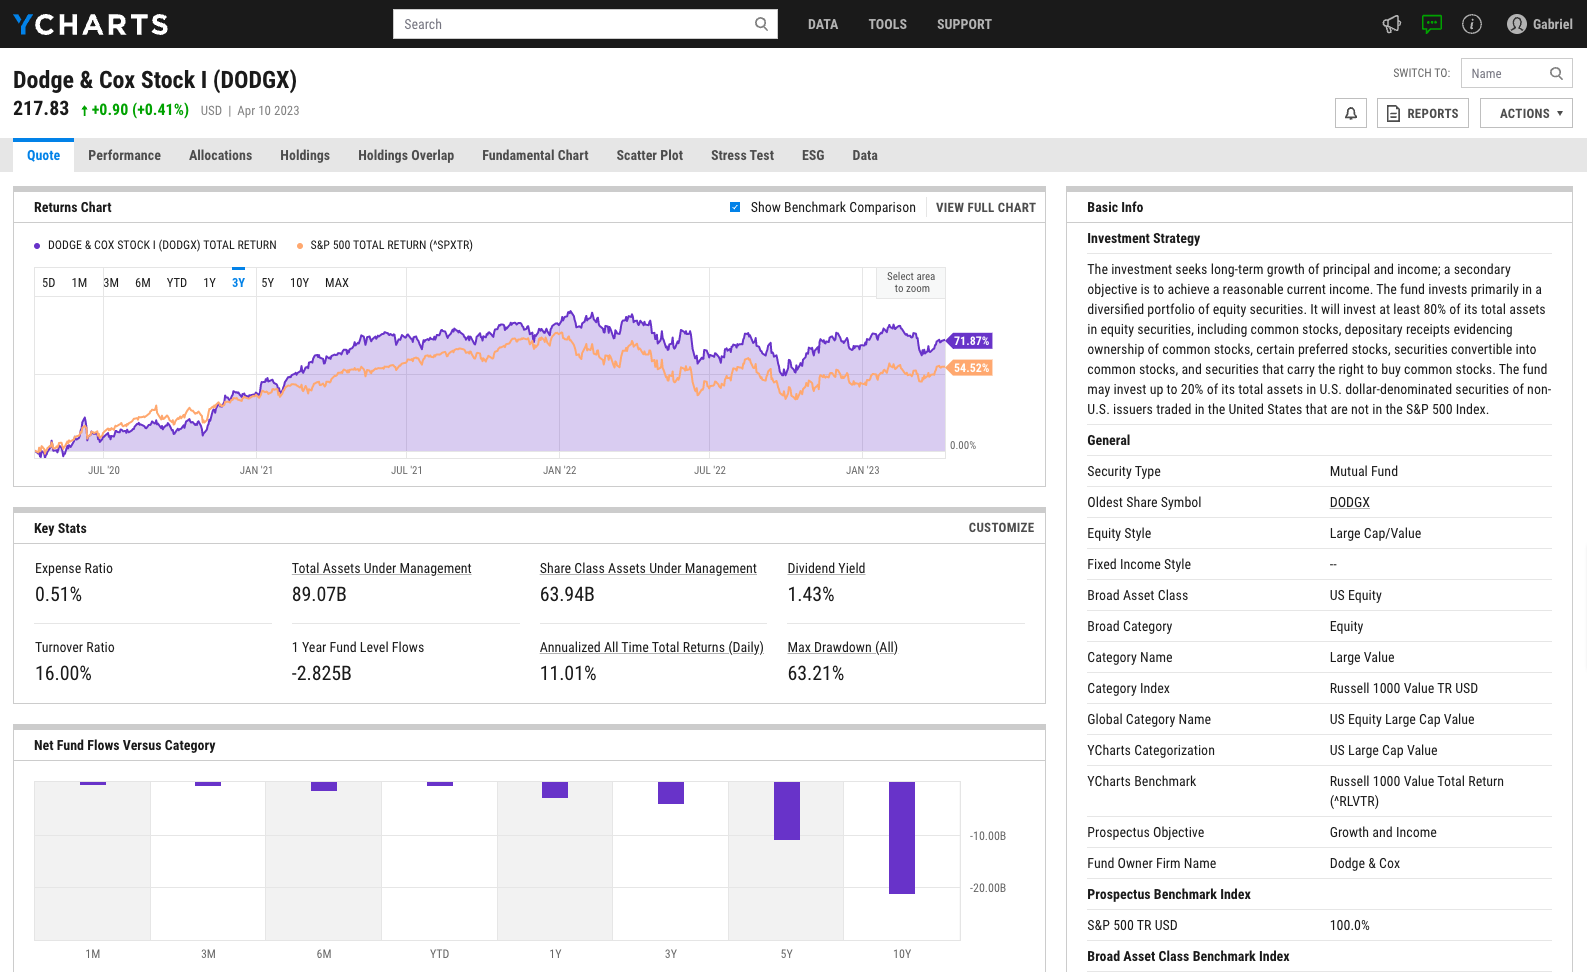
MH Elite Select Portfolio of Funds (MHESX)
5.17
+0.04
(+0.78%)
USD |
Mar 30 2023
Key Stats
Expense Ratio | Total Assets Under Management | Dividend Yield | Turnover Ratio |
---|---|---|---|
0.21% | 6.637M | 0.20% | 44.10% |
1 Year Fund Level Flows | 1 Year Total Returns (Daily) | Annualized All Time Total Returns (Daily) | Max Drawdown (All) |
697131.6 | -11.74% | Upgrade | Upgrade |
Basic Info
Investment Strategy | |
The investment seeks long term capital appreciation. The fund invests at least 80% of its total assets in 15 to 25 unaffiliated open-end mutual funds (underlying funds). It will invest at least 50% of its total assets in underlying funds that invest in non-U.S. companies. The fund may invest in long/short and/or short only funds. An underlying fund may also use derivatives such as options and futures contracts as a substitute for investing directly in equity securities. |
General | |
Security Type | Mutual Fund |
Oldest Share Symbol | MHESX |
Equity Style | Large Cap/Growth |
Fixed Income Style | Medium Quality/Limited Sensitivity |
Broad Asset Class | Allocation |
Broad Category | Allocation |
Category Name | Global Allocation |
Category Index | Morningstar Gbl Allocation TR USD |
Global Category Name | Allocation Miscellaneous |
YCharts Categorization | Other |
YCharts Benchmark | S&P 500 Total Return (^SPXTR) |
Prospectus Objective | Growth |
Fund Owner Firm Name | MH Elite |
Prospectus Benchmark Index | |
MSCI ACWI Ex USA IMI NR USD | 100.0% |
Broad Asset Class Benchmark Index | |
^SPXTR | 100.0% |
Manager Tenure | |
Harvey Merson | 16.91 yrs |
Net Fund Flows Versus Category
1 Month
% Rank:
--
--
Category Low
--
Category High
1 Year
% Rank:
20
697131.6
-3.687B
Category Low
1.484B
Category High
3 Months
% Rank:
--
--
Category Low
--
Category High
3 Years
% Rank:
--
--
Category Low
--
Category High
6 Months
% Rank:
--
--
Category Low
--
Category High
5 Years
% Rank:
--
--
Category Low
--
Category High
YTD
% Rank:
--
--
Category Low
--
Category High
10 Years
% Rank:
--
--
Category Low
--
Category High
As of February 28, 2023
Risk
Performance Versus Category
As of March 30, 2023. Returns for periods of 1 year and above are annualized.
Annual Total Returns Versus Peers
As of March 30, 2023.
Asset Allocation
Top 10 Holdings
Name | % Weight | Price | % Change |
---|---|---|---|
Driehaus Emerging Markets Small Cap Gr | 7.98% | 18.02 | 0.73% |
Wasatch Emerging Markets Select Instl | 7.77% | 15.68 | 1.03% |
WCM Focused International Growth Instl | 7.37% | 21.53 | 0.98% |
PIMCO StocksPLUS® Intl (USD-Hedged) Inst | 7.07% | 7.93 | 0.63% |
Seafarer Overseas Gr and Income Investor | 6.60% | 11.67 | 0.34% |
MFS International Intrinsic Value I | 6.13% | 41.32 | 1.35% |
Vanguard International Growth Adm | 6.06% | 100.92 | 1.63% |
Cohen & Steers Real Estate Securities I | 5.08% | 15.20 | 1.27% |
Vanguard Materials Index Admiral | 5.02% | 89.23 | 0.60% |
Brown Capital Mgmt Intl Sm Co Inv | 4.88% | 19.87 | 1.22% |
Basic Info
Investment Strategy | |
The investment seeks long term capital appreciation. The fund invests at least 80% of its total assets in 15 to 25 unaffiliated open-end mutual funds (underlying funds). It will invest at least 50% of its total assets in underlying funds that invest in non-U.S. companies. The fund may invest in long/short and/or short only funds. An underlying fund may also use derivatives such as options and futures contracts as a substitute for investing directly in equity securities. |
General | |
Security Type | Mutual Fund |
Oldest Share Symbol | MHESX |
Equity Style | Large Cap/Growth |
Fixed Income Style | Medium Quality/Limited Sensitivity |
Broad Asset Class | Allocation |
Broad Category | Allocation |
Category Name | Global Allocation |
Category Index | Morningstar Gbl Allocation TR USD |
Global Category Name | Allocation Miscellaneous |
YCharts Categorization | Other |
YCharts Benchmark | S&P 500 Total Return (^SPXTR) |
Prospectus Objective | Growth |
Fund Owner Firm Name | MH Elite |
Prospectus Benchmark Index | |
MSCI ACWI Ex USA IMI NR USD | 100.0% |
Broad Asset Class Benchmark Index | |
^SPXTR | 100.0% |
Manager Tenure | |
Harvey Merson | 16.91 yrs |
Fundamentals
General | |
Distribution Yield | Upgrade |
Dividend Yield TTM (3-30-23) | 0.20% |
30-Day SEC Yield | -- |
7-Day SEC Yield | -- |
Number of Holdings | Upgrade |
Stock | |
Weighted Average PE Ratio | 17.56 |
Weighted Average Price to Sales Ratio | Upgrade |
Weighted Average Price to Book Ratio | Upgrade |
Weighted Median ROE | Upgrade |
Weighted Median ROA | Upgrade |
Forecasted Dividend Yield | Upgrade |
Forecasted PE Ratio | Upgrade |
Forecasted Price to Sales Ratio | Upgrade |
Forecasted Price to Book Ratio | Upgrade |
Bond | |
Current Yield | 3.74% |
Yield to Maturity | Upgrade |
Effective Duration | Upgrade |
Average Coupon | Upgrade |
Average Credit Score | Upgrade |
Average Price | -- |
As of February 28, 2023
Fund Details
Key Dates | |
Inception Date | 4/6/2006 |
Last Annual Report Date | 12/31/2022 |
Last Prospectus Date | 5/1/2022 |
Attributes | |
Index Fund | No |
Inverse Fund | No |
Leveraged Fund | No |
Fund of Funds |
|
Currency Hedged Fund | No |
Synthetic Replication Fund | No |
Has Dividend Investment Plan | No |
Socially Responsible Fund | No |