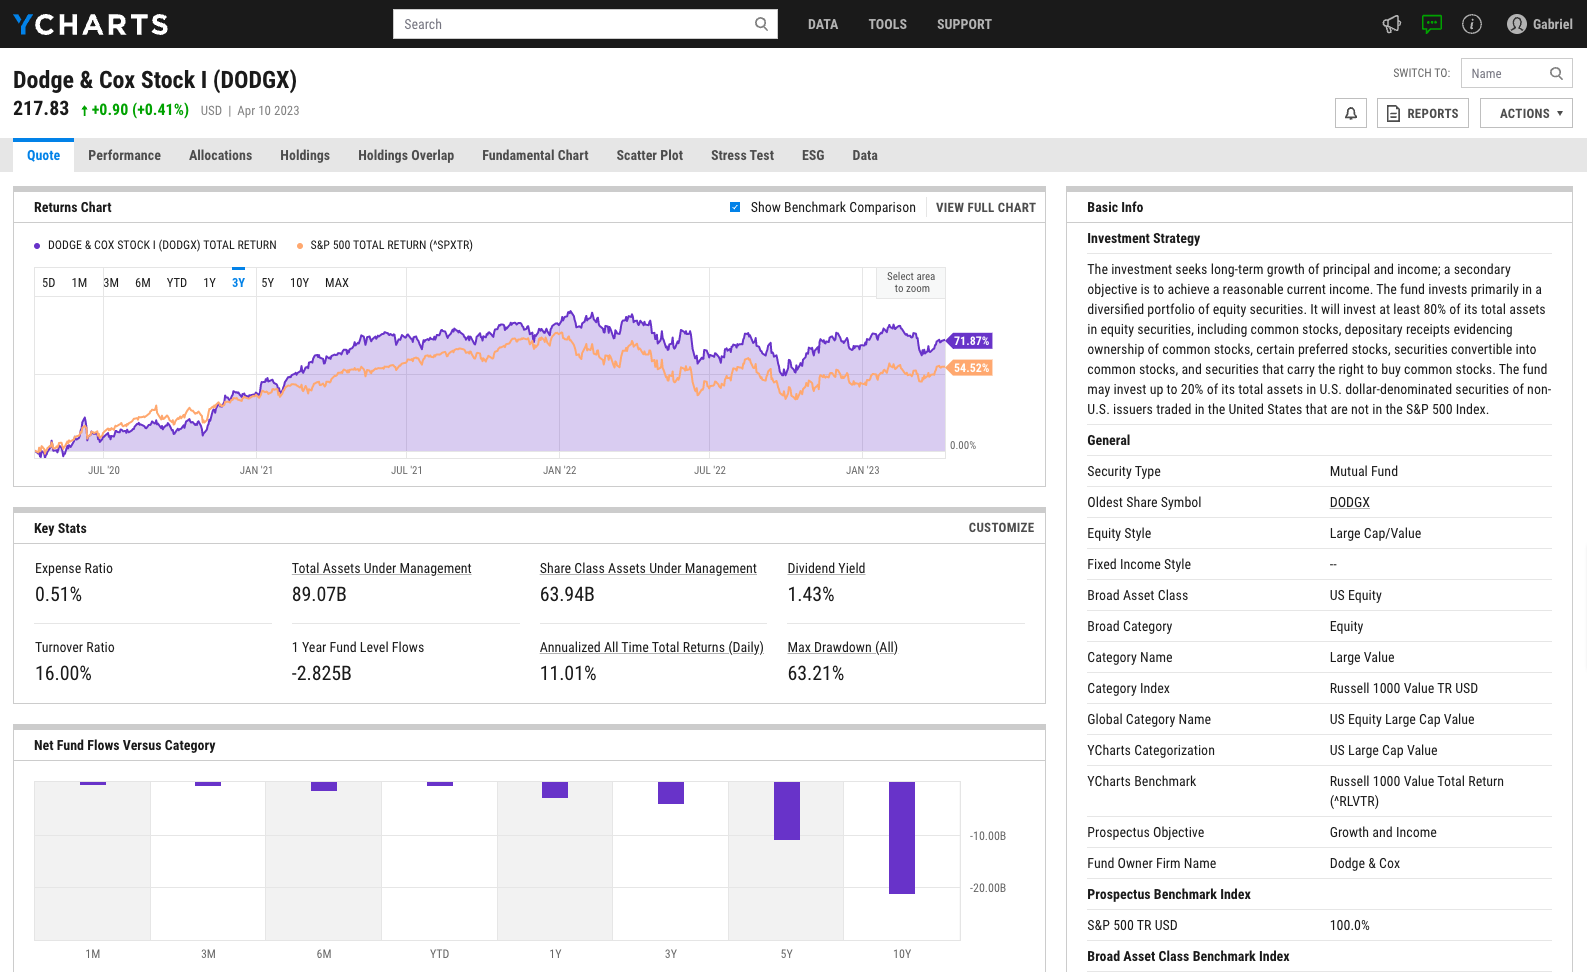
Mackenzie US Mid Cap Opportunities PWX (MFC8124)
12.22
+0.08
(+0.64%)
CAD |
Mar 24 2023
Key Stats
Expense Ratio | Total Assets Under Management | Dividend Yield | Turnover Ratio |
---|---|---|---|
-- | 1.668B | 0.11% | 33.34% |
1 Year Fund Level Flows | 1 Year Total Returns (Daily) | Annualized All Time Total Returns (Daily) | Max Drawdown (All) |
95.62M | -7.96% | Upgrade | Upgrade |
Basic Info
Investment Strategy | |
The Fund seeks to provide long-term capital growth and a reasonable rate of return by investing primarily in equity securities of mid-capitalization companies in the United States. The Fund will pursue this objective by investing in securities directly and/or by investing in other mutual funds. |
General | |
Security Type | Mutual Fund |
Oldest Share Symbol | MFC8113 |
Equity Style | Mid Cap/Blend |
Fixed Income Style | -- |
Broad Asset Class | -- |
Broad Category | Equity |
Category Name | US Small/Mid Cap Equity |
Category Index | Morningstar US SMID TR CAD |
Global Category Name | US Equity Mid Cap |
YCharts Categorization | US Mid Cap |
YCharts Benchmark | Russell Midcap Total Return (^RMCTR) |
Prospectus Objective | -- |
Fund Owner Firm Name | Mackenzie Investments |
Prospectus Benchmark Index | |
S&P 500 TR CAD | 100.0% |
Broad Asset Class Benchmark Index | |
^SPTSX60TR | 100.0% |
Manager Tenure | |
Philip Taller | 2.76 yrs |
Sonny Aggarwal | 2.76 yrs |
Net Fund Flows Versus Category
1 Month
% Rank:
--
--
Category Low
--
Category High
1 Year
% Rank:
12
95.62M
-433.88M
Category Low
426.15M
Category High
3 Months
% Rank:
--
--
Category Low
--
Category High
3 Years
% Rank:
--
--
Category Low
--
Category High
6 Months
% Rank:
--
--
Category Low
--
Category High
5 Years
% Rank:
--
--
Category Low
--
Category High
YTD
% Rank:
--
--
Category Low
--
Category High
10 Years
% Rank:
--
--
Category Low
--
Category High
As of February 28, 2023
Risk
Performance Versus Category
As of March 24, 2023. Returns for periods of 1 year and above are annualized.
Annual Total Returns Versus Peers
As of March 24, 2023.
Asset Allocation
Top 10 Holdings
Name | % Weight | Price | % Change |
---|---|---|---|
Progressive Corp | 5.27% | 140.43 | 1.89% |
Motorola Solutions Inc | 5.01% | 271.68 | 1.31% |
Westinghouse Air Brake Technologies Corp | 4.77% | 95.50 | 0.01% |
Charles River Laboratories International Inc | 4.46% | 193.79 | 0.04% |
Cirrus Logic Inc | 4.39% | 105.59 | -0.22% |
CoStar Group Inc | 4.29% | 67.14 | 1.96% |
Keysight Technologies Inc | 3.97% | 156.70 | 0.17% |
Bio-Techne Corp | 3.90% | 72.54 | 0.86% |
Maximus Inc | 3.89% | 75.08 | 1.12% |
DexCom Inc | 3.63% | 114.09 | -0.36% |
Fees & Availability
Fees | |
Actual 12B-1 Fee | -- |
Actual Management Fee | -- |
Administration Fee | -- |
Performance Fee | -- |
Switching Fee | Upgrade |
Transaction Fee | -- |
Maximum Front Load | -- |
Maximum Deferred Load | -- |
Maximum Redemption Fee | -- |
Basic Info
Investment Strategy | |
The Fund seeks to provide long-term capital growth and a reasonable rate of return by investing primarily in equity securities of mid-capitalization companies in the United States. The Fund will pursue this objective by investing in securities directly and/or by investing in other mutual funds. |
General | |
Security Type | Mutual Fund |
Oldest Share Symbol | MFC8113 |
Equity Style | Mid Cap/Blend |
Fixed Income Style | -- |
Broad Asset Class | -- |
Broad Category | Equity |
Category Name | US Small/Mid Cap Equity |
Category Index | Morningstar US SMID TR CAD |
Global Category Name | US Equity Mid Cap |
YCharts Categorization | US Mid Cap |
YCharts Benchmark | Russell Midcap Total Return (^RMCTR) |
Prospectus Objective | -- |
Fund Owner Firm Name | Mackenzie Investments |
Prospectus Benchmark Index | |
S&P 500 TR CAD | 100.0% |
Broad Asset Class Benchmark Index | |
^SPTSX60TR | 100.0% |
Manager Tenure | |
Philip Taller | 2.76 yrs |
Sonny Aggarwal | 2.76 yrs |
Fundamentals
General | |
Distribution Yield | Upgrade |
Dividend Yield TTM (3-24-23) | 0.11% |
30-Day SEC Yield | -- |
7-Day SEC Yield | -- |
Number of Holdings | Upgrade |
Stock | |
Weighted Average PE Ratio | 22.76 |
Weighted Average Price to Sales Ratio | Upgrade |
Weighted Average Price to Book Ratio | Upgrade |
Weighted Median ROE | Upgrade |
Weighted Median ROA | Upgrade |
Forecasted Dividend Yield | Upgrade |
Forecasted PE Ratio | Upgrade |
Forecasted Price to Sales Ratio | Upgrade |
Forecasted Price to Book Ratio | Upgrade |
As of December 31, 2022
Fund Details
Key Dates | |
Inception Date | 5/27/2020 |
Last Annual Report Date | 3/31/2022 |
Last Prospectus Date | -- |
Share Classes | |
MFC8108 | Commission-based Advice |
MFC8112 | Do-It-Yourself |
MFC8113 | Fee-based Advice |
MFC8114 | Fee-based Advice |
MFC8115 | Fee-based Advice |
MFC8116 | Fee-based Advice |
MFC8117 | Fee-based Advice |
MFC8118 | Institutional |
MFC8119 | Commission-based Advice |
MFC8120 | Fee-based Advice |
MFC8121 | Fee-based Advice |
MFC8122 | Commission-based Advice |
MFC8123 | Commission-based Advice |
MFC8125 | Fee-based Advice |
MFC8126 | Commission-based Advice |
MFC8130 | Commission-based Advice |
MFC9547 | Commission-based Advice |
MFC9548 | Commission-based Advice |
MFC9549 | Commission-based Advice |
MFC9550 | Commission-based Advice |
MFC9551 | Commission-based Advice |
MFC9552 | Commission-based Advice |
MRD193 | Commission-based Advice |
MRD793 | Commission-based Advice |
Attributes | |
Index Fund | No |
Inverse Fund | No |
Leveraged Fund | No |
Fund of Funds | No |
Currency Hedged Fund | No |
Synthetic Replication Fund | No |
Has Dividend Investment Plan | No |
Socially Responsible Fund | No |