

Fidelity Strategic Advisers Fidelity EM Fund (FGOMX)
18.81
+0.29
(+1.57%)
USD |
Jul 14 2026
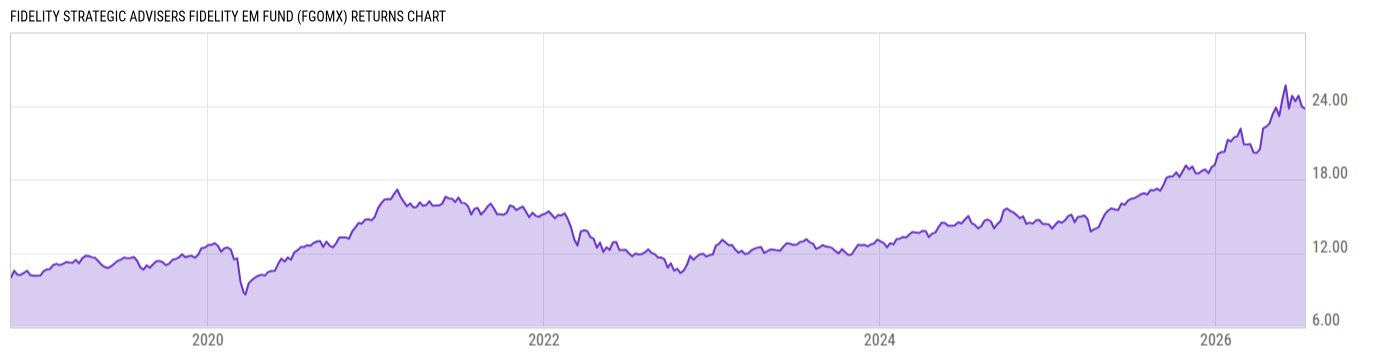
Returns Chart
Key Stats
| Net Expense Ratio | Total Assets Under Management | Weighted Average Dividend Yield | Turnover Ratio (Generic) |
|---|---|---|---|
| 0.32% | 41.23B | 1.56% | 53.00% |
| 1 Year Fund Level Flows | 1 Year Total Returns (Daily) | Annualized Total Returns Since Inception (Daily) | Max Drawdown (Since Inception) |
| 328.73M | 44.48% |
Basic Info
| Investment Strategy | |
| The Fund seeks capital appreciation. It invests in securities of issuers in emerging markets and other investments that are tied to emerging markets and in shares of other emerging markets equity funds. Allocates assets among affiliated emerging markets funds and non-affiliated ETFs, and closed-end funds and sub-advisers. |
| General | |
| Security Type | Mutual Fund |
| Equity Style | Large Cap Core |
| Broad Asset Class | International Equity |
| Broad Category | Equity |
| Global Peer Group | Equity Emerging Markets Global |
| Peer Group | Emerging Markets Funds |
| Global Macro | Equity Emerging Markets |
| US Macro | Emerging Markets Equity Funds |
| YCharts Categorization | -- |
| YCharts Benchmark | -- |
| Prospectus Objective | Emerging Markets Funds |
| Fund Owner Firm Name | Fidelity Investments |
| Broad Asset Class Benchmark Index | |
| ^MSACXUSNTR | 100.0% |
Net Fund Flows Versus Peer Group
1 Month
% Rank:
100
-1.679B
Peer Group Low
878.63M
Peer Group High
1 Year
% Rank:
6
328.73M
-8.333B
Peer Group Low
19.77B
Peer Group High
3 Months
% Rank:
3
-2.294B
Peer Group Low
4.258B
Peer Group High
3 Years
% Rank:
2
-20.46B
Peer Group Low
23.14B
Peer Group High
6 Months
% Rank:
99
-3.162B
Peer Group Low
9.466B
Peer Group High
5 Years
% Rank:
2
-33.64B
Peer Group Low
29.53B
Peer Group High
YTD
% Rank:
99
-3.162B
Peer Group Low
9.466B
Peer Group High
10 Years
% Rank:
1
-33.66B
Peer Group Low
75.09B
Peer Group High
Date Unavailable
Risk
Performance Versus Peer Group
Annual Total Returns Versus Peers
As of July 15, 2026.
Asset Allocation
As of May 31, 2026.
| Type | % Net |
|---|---|
| Cash | 3.07% |
| Stock | 91.47% |
| Bond | 2.49% |
| Convertible | 0.00% |
| Preferred | 1.90% |
| Other | 1.06% |
Top 10 Holdings
| Name | % Weight | Price | % Change |
|---|---|---|---|
| Fidelity SAI Emerging Markets Value Index | 23.37% | 21.47 | 1.46% |
| Taiwan Semiconductor Manufacturing Co., Ltd. | 9.13% | 17.24 | 0.00% |
| Fidelity SAI Emerging Markets Low Volatility Index | 5.37% | 12.85 | 0.39% |
| Fidelity SAI Emerging Markets Index Fund | 5.18% | 21.16 | 1.58% |
| Samsung Electronics Co., Ltd. | 4.98% | 140.00 | 0.00% |
|
MSCI EMERG JUN6
|
3.87% | -- | -- |
| Invesco Government & Agency Portfolio Inst | 3.56% | 1.00 | 0.00% |
|
SK Hynix Inc ORD
|
3.37% | -- | -- |
| Tencent Holdings Ltd. | 1.87% | 57.12 | -1.76% |
|
Fidelity Cash Central Fund
|
1.41% | -- | -- |
Fees & Availability
| Fees | |
| Actual 12B-1 Fee | -- |
| Actual Management Fee | 0.19% |
| Administration Fee | -- |
| Maximum Front Load | -- |
| Maximum Deferred Load | -- |
| Maximum Redemption Fee | -- |
| General Availability | |
| Available for Insurance Product | No |
| Available for RRSP | No |
| Purchase Details | |
| Open to New Investors | No |
| Minimum Initial Investment | 0.00 None |
| Minimum Subsequent Investment | 0.00 None |
Projected Income
| Type | Jul | Aug | Sep | Oct | Nov | Dec | Jan | Feb | Mar | Apr | May | Jun |
|---|---|---|---|---|---|---|---|---|---|---|---|---|
|
Qualified Income
|
-- | -- | -- | -- | -- | -- | -- | -- | -- | -- | -- | -- |
|
Normal
|
-- | -- | -- | -- | -- | -- | -- | -- | -- | -- | -- | -- |
|
Qualified
|
-- | -- | -- | -- | -- | -- | -- | -- | -- | -- | -- | -- |
|
LT Cap Gains
|
-- | -- | -- | -- | -- | -- | -- | -- | -- | -- | -- | -- |
|
Ordinary Income
|
-- | -- | -- | -- | -- | -- | -- | -- | -- | -- | -- | -- |
|
Non-Qual
|
-- | -- | -- | -- | -- | -- | -- | -- | -- | -- | -- | -- |
|
ST Cap Gains
|
-- | -- | -- | -- | -- | -- | -- | -- | -- | -- | -- | -- |
|
ROC
|
-- | -- | -- | -- | -- | -- | -- | -- | -- | -- | -- | -- |
|
Other
|
-- | -- | -- | -- | -- | -- | -- | -- | -- | -- | -- | -- |
|
Total
|
-- | -- | -- | -- | -- | -- | -- | -- | -- | -- | -- | -- |
As of June 30, 2026.
Basic Info
| Investment Strategy | |
| The Fund seeks capital appreciation. It invests in securities of issuers in emerging markets and other investments that are tied to emerging markets and in shares of other emerging markets equity funds. Allocates assets among affiliated emerging markets funds and non-affiliated ETFs, and closed-end funds and sub-advisers. |
| General | |
| Security Type | Mutual Fund |
| Equity Style | Large Cap Core |
| Broad Asset Class | International Equity |
| Broad Category | Equity |
| Global Peer Group | Equity Emerging Markets Global |
| Peer Group | Emerging Markets Funds |
| Global Macro | Equity Emerging Markets |
| US Macro | Emerging Markets Equity Funds |
| YCharts Categorization | -- |
| YCharts Benchmark | -- |
| Prospectus Objective | Emerging Markets Funds |
| Fund Owner Firm Name | Fidelity Investments |
| Broad Asset Class Benchmark Index | |
| ^MSACXUSNTR | 100.0% |
Fundamentals
| General | |
| Distribution Yield | -- |
| Dividend Yield TTM (7-14-26) | 2.93% |
| 30-Day SEC Yield (10-3-23) | 0.00% |
| 7-Day SEC Yield (10-3-23) | 0.00% |
| Number of Holdings | 323 |
| Stock | |
| Weighted Average PE Ratio | 25.77 |
| Weighted Average Price to Sales Ratio | 7.692 |
| Weighted Average Price to Book Ratio | 5.830 |
| Weighted Median ROE | 23.52% |
| Weighted Median ROA | 12.80% |
| ROI (TTM) | 19.30% |
| Return on Investment (TTM) | 19.30% |
| Earning Yield | 0.0614 |
| LT Debt / Shareholders Equity | 0.3403 |
| Number of Equity Holdings | 292 |
As of May 31, 2026
Growth Metrics
| EPS Growth (1Y) | 29.01% |
| EPS Growth (3Y) | 18.55% |
| EPS Growth (5Y) | 22.38% |
| Sales Growth (1Y) | 17.32% |
| Sales Growth (3Y) | 12.32% |
| Sales Growth (5Y) | 15.62% |
| Sales per Share Growth (1Y) | 20.95% |
| Sales per Share Growth (3Y) | 12.20% |
| Operating Cash Flow - Growth Rate (3Y) | 17.55% |
As of May 31, 2026
Fund Details
| Key Dates | |
| Inception Date | 10/30/2018 |
| Last Annual Report Date | 5/31/2025 |
| Last Prospectus Date | 7/30/2025 |
| Attributes | |
| Index Fund | -- |
| Inverse Fund | No |
| Leveraged Fund | -- |
| Fund of Funds |
|
| Currency Hedged Fund | -- |
| Socially Responsible Fund | No |
Top Portfolio Holders
| Name | % Weight |
|---|---|
| Portfolio A | 5.00% |
| Portfolio B | 3.50% |
| Portfolio C | 2.25% |
Excel Add-In Codes
| Name: =YCI("M:FGOMX", "name") |
| Broad Asset Class: =YCI("M:FGOMX", "broad_asset_class") |
| Broad Category: =YCI("M:FGOMX", "broad_category_group") |
| Prospectus Objective: =YCI("M:FGOMX", "prospectus_objective") |
| To find the codes for any of our securities and financial metrics, see our Complete Excel Reference. |