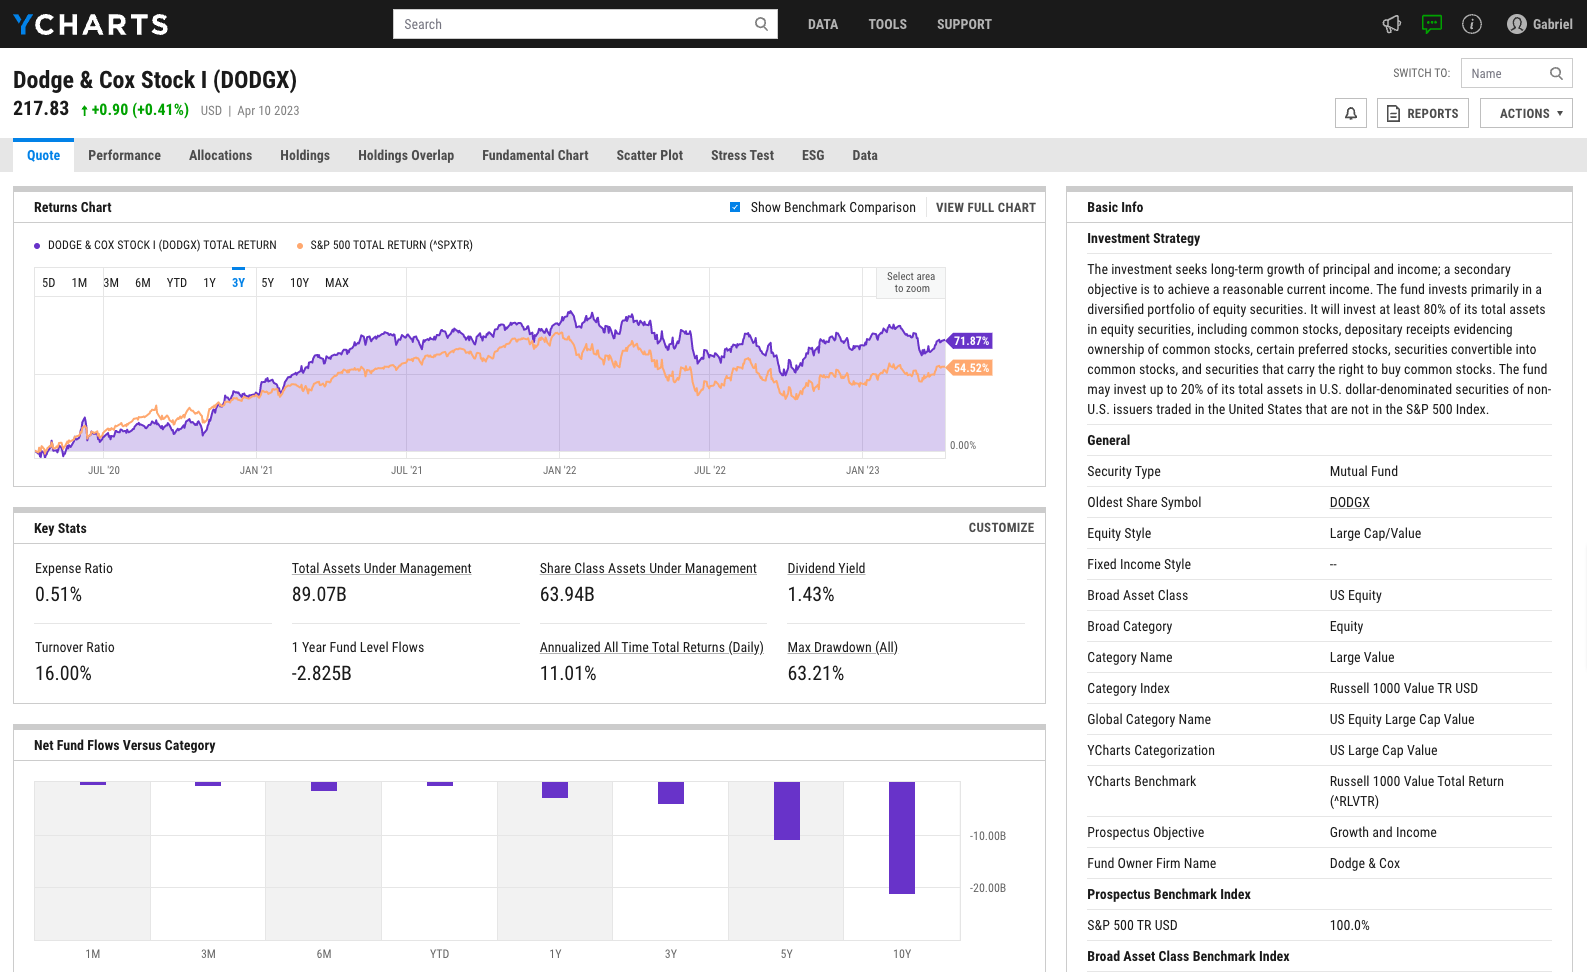
Basic Info

Investment Strategy
The investment seeks to maximize current income, to the extent consistent with the preservation of capital and liquidity and the maintenance of a stable $1.00 per share net asset value (“NAV”). The U.S. government Portfolio is a government money market fund and invests only in obligations issued or guaranteed as to principal and/or interest, as applicable, by the U.S. government or its agencies and instrumentalities, as well as repurchase agreements secured by such instruments. The Portfolio invests in accordance with regulatory requirements applicable to money market funds.
General
Security Type Mutual Fund
Oldest Share Symbol F00000QEOL
Equity Style --
Fixed Income Style --
Broad Asset Class Money Market
Broad Category Money Market
Category Name Money Market-Taxable
Category Index --
Global Category Name US Money Market
YCharts Categorization Money Market
YCharts Benchmark Bloomberg US Treasury Bills 1-3 Month (^BBUTB13MTR)
Prospectus Objective Money Mkt - Government
Fund Owner Firm Name State Street Master Funds
Prospectus Benchmark Index
N/A 100.0%
Broad Asset Class Benchmark Index
^BBUTB13MTR 100.0%
Manager Tenure
Management Team 8.55 yrs

Net Fund Flows Versus Category

1M
3M
6M
YTD
1Y
3Y
5Y
10Y
 
80.00B
60.00B
40.00B
20.00B
0
-20.00B
No Data Available
1 Month
% Rank: --
-- Category Low
-- Category High
1 Year
% Rank: --
-55.19B Category Low
32.79B Category High
3 Months
% Rank: --
-- Category Low
-- Category High
3 Years
% Rank: --
-- Category Low
-- Category High
6 Months
% Rank: --
-- Category Low
-- Category High
5 Years
% Rank: --
-- Category Low
-- Category High
YTD
% Rank: --
-- Category Low
-- Category High
10 Years
% Rank: --
-- Category Low
-- Category High
Date Unavailable

Performance Versus Category

 
20%
15%
10%
5%
0
No Data Available
Name
1M
3M
YTD
1Y
3Y
5Y
10Y
15Y
Total Return (NAV)
--
--
--
--
--
--
--
--
Category Rtn. (NAV)
--
--
--
--
--
--
--
--
% Rank in Cat (NAV)
--
--
--
--
--
--
--
--

Annual Total Returns Versus Peers

Loading chart...
Name
2016
2017
2018
2019
2020
2021
2022
YTD
--
--
--
--
--
--
--
--
0.26%
0.82%
1.82%
2.21%
0.54%
0.04%
1.52%
1.05%
0.04%
0.51%
1.48%
1.84%
0.26%
0.01%
1.31%
0.94%
0.01%
0.48%
1.45%
1.81%
0.29%
0.01%
1.24%
0.92%
0.22%
0.79%
1.78%
2.16%
0.43%
0.01%
1.53%
0.99%
0.20%
0.70%
1.67%
2.03%
0.32%
0.01%
1.15%
0.98%
As of March 26, 2023.

Fundamentals

General
Distribution Yield --
Dividend Yield TTM --
30-Day SEC Yield --
7-Day SEC Yield --
Number of Holdings Upgrade
Bond
Current Yield --
Yield to Maturity --
Effective Duration --
Average Coupon --
Average Credit Score --
Average Price --
As of February 28, 2023

Asset Allocation

As of February 28, 2023.
Type % Net % Long % Short
Cash 82.30% Upgrade Upgrade
Stock 0.00% Upgrade Upgrade
Bond 17.70% Upgrade Upgrade
Convertible 0.00% Upgrade Upgrade
Preferred 0.00% Upgrade Upgrade
Other 0.00% Upgrade Upgrade

Top 10 Holdings

Name % Weight Price % Change
Federal Reserve Bank Tri Party Repo Federal Reserve Bank Tri Party Repo 4.5
24.50% -- --
Fixed Income Clearing Co Tri Party Repo Fixed Income Clearing Co Tri Party
16.94% -- --
Goldman Sachs Tri Party Repo Goldman Sachs Tri Party Repo 4.560000%
9.83% -- --
Jpm Chase Tri Party Repo Jpm Chase Tri Party Repo 4.550000%
4.85% -- --
United States Treasury Notes
3.79% -- --
Goldman Sachs Tri Party Repo Goldman Sachs Tri Party Repo 4.560000%
2.76% -- --
Fixed Income Clearing Co Repo Fixed Income Clearing Co Repo 4.550000%
2.57% -- --
United States Treasury Notes
2.18% -- --
United States Treasury Notes
2.04% -- --
Wells Fargo Tri Party Repo Wells Fargo Tri Party Repo 4.560000%
1.59% -- --

Fees & Availability

Fees
Actual 12B-1 Fee --
Actual Management Fee Upgrade
Administration Fee --
Performance Fee --
Switching Fee --
Transaction Fee --
Maximum Front Load --
Maximum Deferred Load --
Maximum Redemption Fee --
General Availability
Available for Insurance Product No
Available for Retirement Plan No
Available for RRSP No
Purchase Details
Open to New Investors Yes
Open to Existing Investors Yes
Minimum Initial Investment Upgrade
Minimum Subsequent Investment Upgrade

Basic Info

Investment Strategy
The investment seeks to maximize current income, to the extent consistent with the preservation of capital and liquidity and the maintenance of a stable $1.00 per share net asset value (“NAV”). The U.S. government Portfolio is a government money market fund and invests only in obligations issued or guaranteed as to principal and/or interest, as applicable, by the U.S. government or its agencies and instrumentalities, as well as repurchase agreements secured by such instruments. The Portfolio invests in accordance with regulatory requirements applicable to money market funds.
General
Security Type Mutual Fund
Oldest Share Symbol F00000QEOL
Equity Style --
Fixed Income Style --
Broad Asset Class Money Market
Broad Category Money Market
Category Name Money Market-Taxable
Category Index --
Global Category Name US Money Market
YCharts Categorization Money Market
YCharts Benchmark Bloomberg US Treasury Bills 1-3 Month (^BBUTB13MTR)
Prospectus Objective Money Mkt - Government
Fund Owner Firm Name State Street Master Funds
Prospectus Benchmark Index
N/A 100.0%
Broad Asset Class Benchmark Index
^BBUTB13MTR 100.0%
Manager Tenure
Management Team 8.55 yrs

Fundamentals

General
Distribution Yield --
Dividend Yield TTM --
30-Day SEC Yield --
7-Day SEC Yield --
Number of Holdings Upgrade
Bond
Current Yield --
Yield to Maturity --
Effective Duration --
Average Coupon --
Average Credit Score --
Average Price --
As of February 28, 2023

Fund Details

Key Dates
Inception Date 8/13/2014
Last Annual Report Date 12/31/2022
Last Prospectus Date 4/30/2022
Attributes
Index Fund No
Inverse Fund No
Leveraged Fund No
Fund of Funds No
Currency Hedged Fund No
Synthetic Replication Fund No
Has Dividend Investment Plan No
Socially Responsible Fund No

Top Portfolio Holders

0 of 0