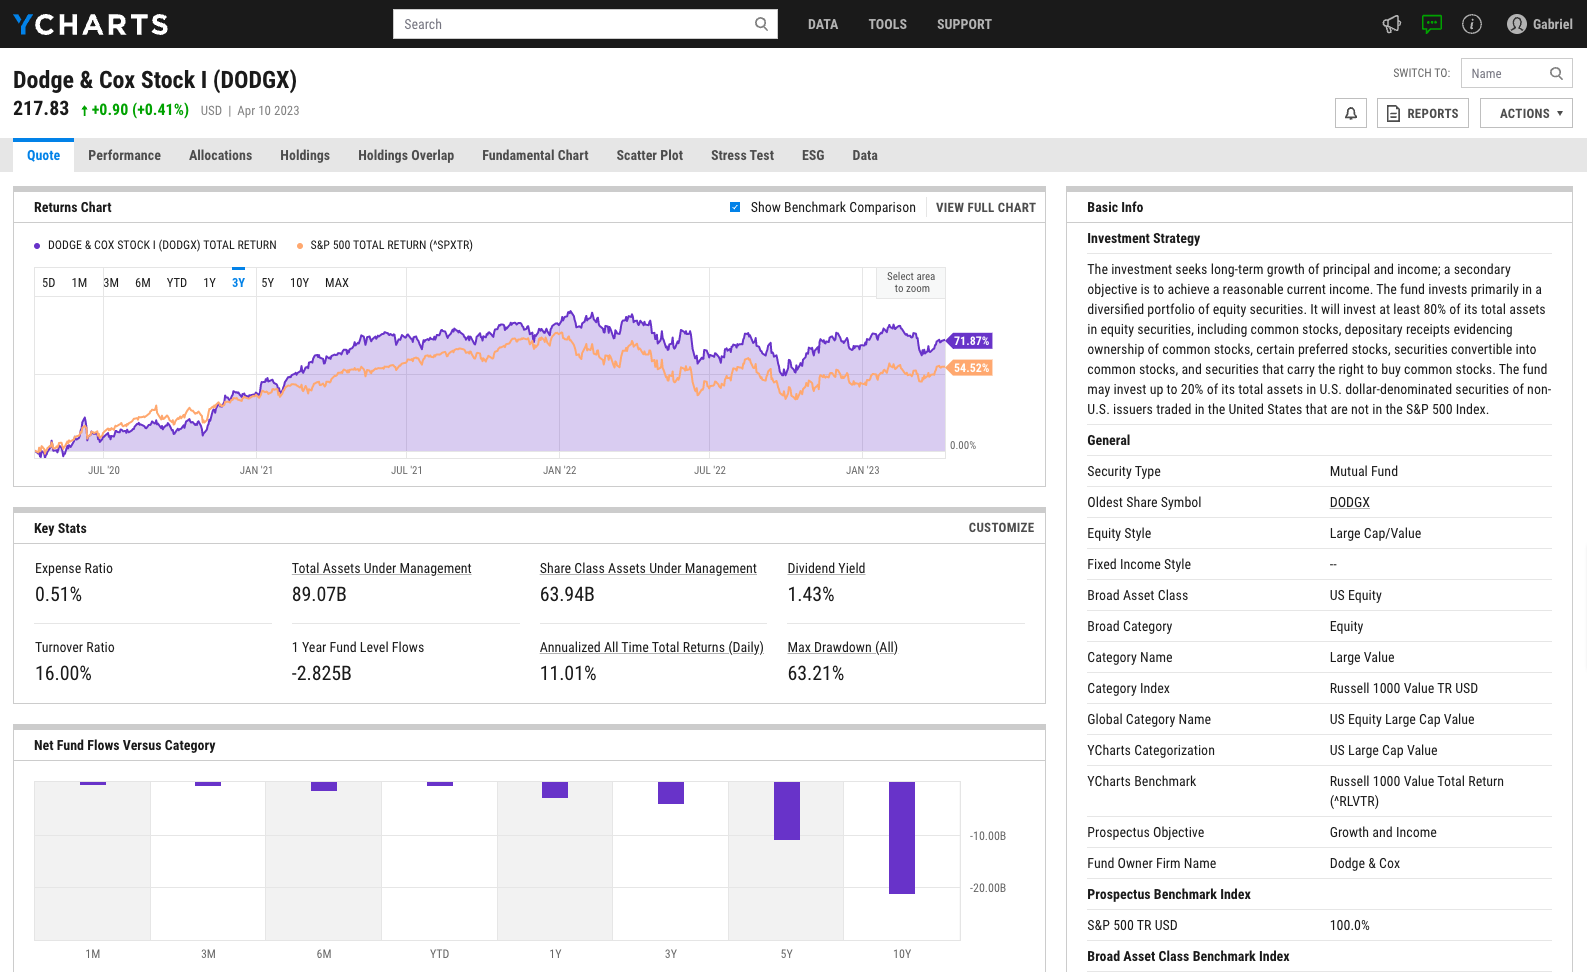
CI Global Health Sciences Corp Cl Z (CIG2924)
24.02
+0.16 (+0.67%)
CAD |
Jul 05 2022
Returns Chart
Key Stats
Customize
Expense Ratio | Total Assets Under Management | Dividend Yield | Turnover Ratio |
---|---|---|---|
2.44% | 156.33M | 0.11% | 13.70% |
1 Year Fund Level Flows | 1 Year Total Returns (Daily) | Annualized All Time Total Returns (Daily) | Max Drawdown (All) |
-14.13M | -13.63% | Upgrade | Upgrade |
Basic Info
Investment Strategy | |
This fund’s objective is to obtain maximum long-term capital growth. It invests primarily in equity and equity-related securities of companies around the world that specialize in the health care or medical industry. This includes companies that provide goods and services to these companies and companies that the portfolio adviser believes would benefit from developments in the health sciences industry. |
General | |
Security Type | Mutual Fund |
Oldest Share Symbol | CIG1701 |
Equity Style | Large Cap/Blend |
Fixed Income Style | -- |
Broad Asset Class | -- |
Broad Category | Equity |
Category Name | Sector Equity |
Category Index | Morningstar Gbl Mkts GR CAD |
Prospectus Objective | -- |
Fund Owner Firm Name | CI Investments Inc |
Prospectus Benchmark Index | |
NASDAQ Biotechnology TR | 50.00% |
S&P 500 Ind/Pharmaceuticals TR | 50.00% |
Broad Asset Class Benchmark Index | |
^SPTSX60TR | 100.0% |
Manager Tenure | |
Greg Quickmire | 0.23 yrs |
Kevin McSweeney | 0.23 yrs |
Peter Hofstra | 0.23 yrs |
Net Fund Flows Versus Category
1 Month
% Rank:
--
--
Category Low
--
Category High
1 Year
% Rank:
90
-14.13M
-391.33M
Category Low
445.62M
Category High
3 Months
% Rank:
--
--
Category Low
--
Category High
3 Years
% Rank:
--
--
Category Low
--
Category High
6 Months
% Rank:
--
--
Category Low
--
Category High
5 Years
% Rank:
--
--
Category Low
--
Category High
YTD
% Rank:
--
--
Category Low
--
Category High
10 Years
% Rank:
--
--
Category Low
--
Category High
As of May 31, 2022
Performance Versus Category
As of July 05, 2022. Returns for periods of 1 year and above are annualized.
Annual Total Returns Versus Peers
As of July 05, 2022.
Asset Allocation
Top 10 Holdings
Name | % Weight | Price | % Change |
---|---|---|---|
UnitedHealth Group Inc | 8.06% | 513.19 | 1.57% |
Johnson & Johnson | 7.46% | 178.45 | 0.17% |
Novo Nordisk A/S Class B
|
5.29% | -- | -- |
Eli Lilly and Co | 4.84% | 331.24 | 1.24% |
AstraZeneca PLC
|
4.80% | -- | -- |
Roche Holding AG
|
4.61% | -- | -- |
Pfizer Inc | 4.02% | 52.48 | 1.63% |
Merck & Co Inc | 3.89% | 94.24 | 1.73% |
Thermo Fisher Scientific Inc | 3.80% | 553.02 | 1.46% |
Amgen Inc | 3.16% | 246.96 | 0.09% |
Basic Info
Investment Strategy | |
This fund’s objective is to obtain maximum long-term capital growth. It invests primarily in equity and equity-related securities of companies around the world that specialize in the health care or medical industry. This includes companies that provide goods and services to these companies and companies that the portfolio adviser believes would benefit from developments in the health sciences industry. |
General | |
Security Type | Mutual Fund |
Oldest Share Symbol | CIG1701 |
Equity Style | Large Cap/Blend |
Fixed Income Style | -- |
Broad Asset Class | -- |
Broad Category | Equity |
Category Name | Sector Equity |
Category Index | Morningstar Gbl Mkts GR CAD |
Prospectus Objective | -- |
Fund Owner Firm Name | CI Investments Inc |
Prospectus Benchmark Index | |
NASDAQ Biotechnology TR | 50.00% |
S&P 500 Ind/Pharmaceuticals TR | 50.00% |
Broad Asset Class Benchmark Index | |
^SPTSX60TR | 100.0% |
Manager Tenure | |
Greg Quickmire | 0.23 yrs |
Kevin McSweeney | 0.23 yrs |
Peter Hofstra | 0.23 yrs |
Fundamentals
General | |
Distribution Yield | Upgrade |
Dividend Yield TTM (7-5-22) | 0.11% |
30-Day SEC Yield | -- |
7-Day SEC Yield | -- |
Number of Holdings | Upgrade |
Stock | |
Weighted Average PE Ratio | 23.64 |
Weighted Average Price to Sales Ratio | Upgrade |
Weighted Average Price to Book Ratio | Upgrade |
Weighted Median ROE | Upgrade |
Weighted Median ROA | Upgrade |
Forecasted Dividend Yield | Upgrade |
Forecasted PE Ratio | Upgrade |
Forecasted Price to Sales Ratio | Upgrade |
Forecasted Price to Book Ratio | Upgrade |
As of May 31, 2022
Growth Estimates
Fund Details
Key Dates | |
Inception Date | 8/14/2009 |
Last Annual Report Date | 3/31/2022 |
Last Prospectus Date | -- |
Share Classes | |
CIG1401 | -- |
CIG15005 | Fee-based Advice |
CIG16005 | Commission-based Advice |
CIG1701 | Commission-based Advice |
CIG18005 | Institutional |
CIG224 | Fee-based Advice |
CIG2926 | -- |
CIG324 | -- |
CIG4924 | Fee-based Advice |
CIG4926 | -- |
CIG886 | Institutional |
CIG90024 | Commission-based Advice |
CIG90324 | -- |
Attributes | |
Enhanced Index Fund | No |
Index Fund | No |
Inverse Fund | No |
Leveraged Fund | No |
Fund of Funds | No |
Currency Hedged Fund | No |
Synthetic Replication Fund | No |
Has Dividend Investment Plan | No |
Socially Responsible Fund | No |