United Enhanced Income Pool Cl OF (CIG19319)
19.32
+0.06 (+0.29%)
CAD |
May 20 2022
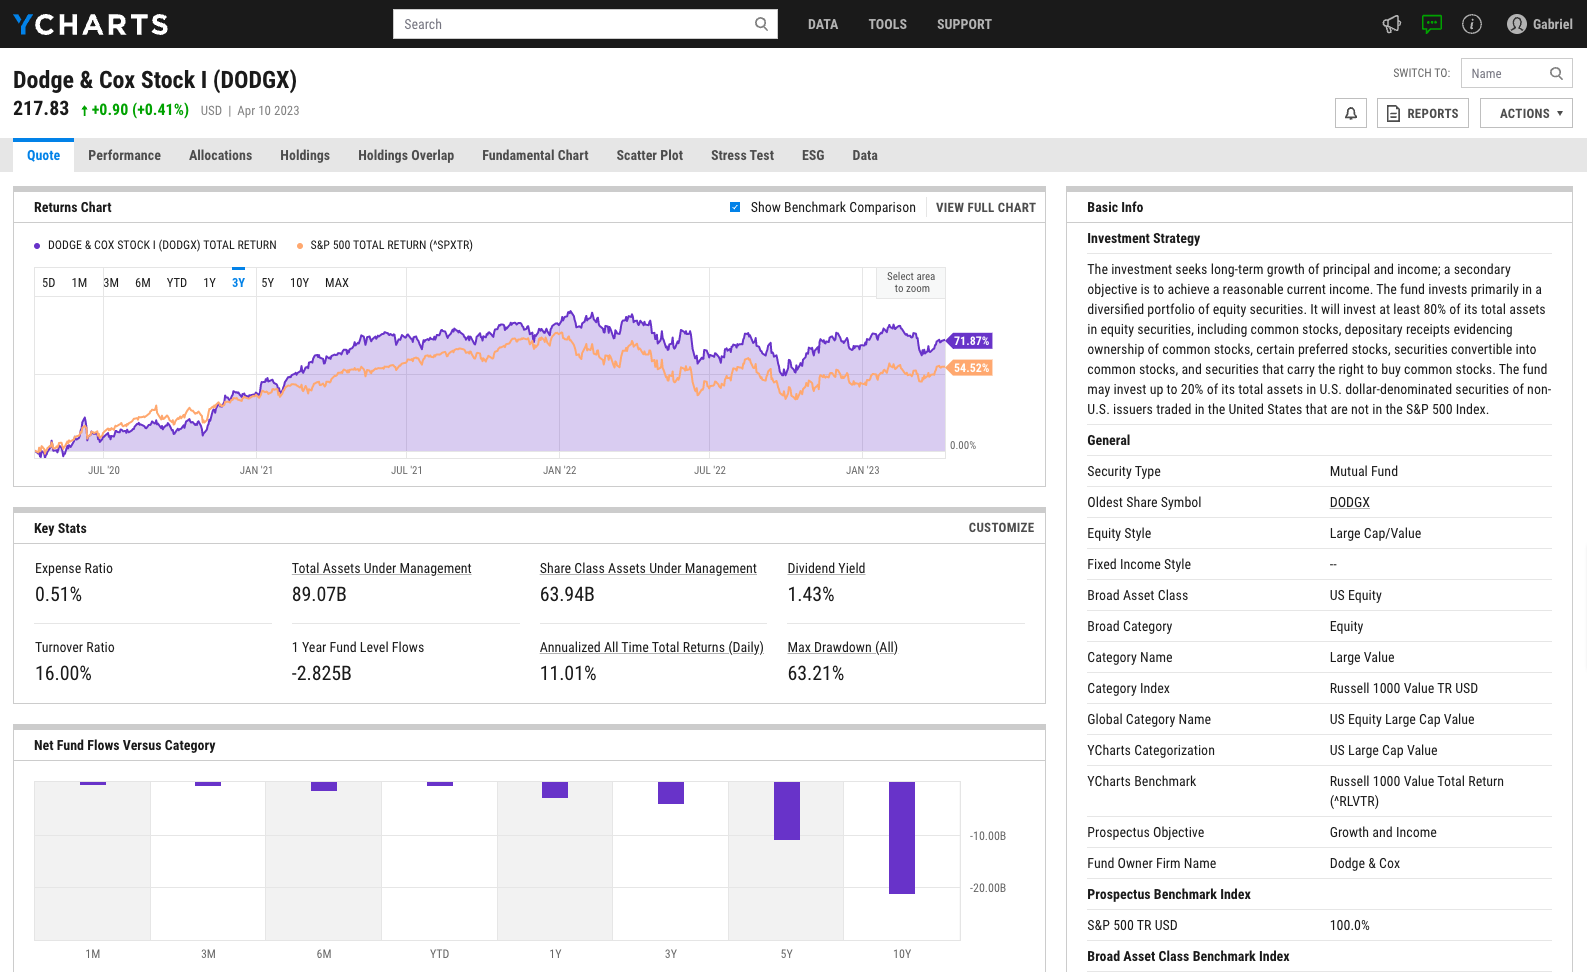
Returns Chart
Key Stats
Customize
Expense Ratio | Total Assets Under Management | Dividend Yield | Turnover Ratio |
---|---|---|---|
1.28% | 1.302B | 1.38% | 37.24% |
1 Year Fund Level Flows | 1 Year Total Returns (Daily) | Annualized All Time Total Returns (Daily) | Max Drawdown (All) |
-6.870M | -0.96% | Upgrade | Upgrade |
Basic Info
Investment Strategy | |
The primary investment objective of the Pool is to maximize performance through current income and capital appreciation while maintaining safety of capital through direct and indirect investments primarily in corporate bonds, income trusts, and other income generating securities. The advisor may also choose to invest a portion of the assets in securities denominated in foreign currencies and/or in securities issued by foreigners. |
General | |
Security Type | Mutual Fund |
Oldest Share Symbol | CIG1569 |
Equity Style | Large Cap/Blend |
Fixed Income Style | -- |
Broad Asset Class | -- |
Broad Category | Allocation |
Category Name | Tactical Balanced |
Category Index | Morningstar Can Neu Gbl Tgt Alloc NR CAD |
Prospectus Objective | -- |
Fund Owner Firm Name | CI Investments Inc |
Prospectus Benchmark Index | |
FTSE Canada Universe Bond | 20.00% |
ICE BofA US High Yield TR USD | 40.00% |
MSCI World GR CAD | 20.00% |
S&P/TSX Composite TR | 20.00% |
Broad Asset Class Benchmark Index | |
^SPTSX60TR | 100.0% |
Manager Tenure | |
Geof Marshall | 16.50 yrs |
Eric Bushell | 6.09 yrs |
Net Fund Flows Versus Category
1 Month
% Rank:
--
--
Category Low
--
Category High
1 Year
% Rank:
61
-6.870M
-573.15M
Category Low
1.362B
Category High
3 Months
% Rank:
--
--
Category Low
--
Category High
3 Years
% Rank:
--
--
Category Low
--
Category High
6 Months
% Rank:
--
--
Category Low
--
Category High
5 Years
% Rank:
--
--
Category Low
--
Category High
YTD
% Rank:
--
--
Category Low
--
Category High
10 Years
% Rank:
--
--
Category Low
--
Category High
As of April 30, 2022
Performance Versus Category
As of May 20, 2022. Returns for periods of 1 year and above are annualized.
Annual Total Returns Versus Peers
As of May 20, 2022.
Asset Allocation
Top 10 Holdings
Name | % Weight | Price | % Change |
---|---|---|---|
iShares Core MSCI EAFE ETF | 8.86% | 63.86 | 0.65% |
iShares Core S&P/TSX Capped Compost ETF | 7.90% | 32.22 | 0.03% |
CI Munro Alternative Global Growth I | 6.92% | 12.41 | -0.14% |
VanEck Semiconductor ETF | 4.16% | 228.17 | 0.05% |
CI DoubleLine Cr Pls Fxd Inc US$ IH | 3.31% | 8.932 | 0.29% |
CI Income Fund Class I | 2.98% | 7.612 | 0.28% |
CI CanBanc Income Class ETF | 2.96% | 12.33 | 0.24% |
CI High Yield Bond I | 2.94% | 9.065 | 0.08% |
SPDR® Blmbg Em Mkts Lcl Bd ETF | 2.92% | 21.16 | 0.33% |
Franklin FTSE Japan ETF | 2.92% | 25.19 | 1.16% |
Basic Info
Investment Strategy | |
The primary investment objective of the Pool is to maximize performance through current income and capital appreciation while maintaining safety of capital through direct and indirect investments primarily in corporate bonds, income trusts, and other income generating securities. The advisor may also choose to invest a portion of the assets in securities denominated in foreign currencies and/or in securities issued by foreigners. |
General | |
Security Type | Mutual Fund |
Oldest Share Symbol | CIG1569 |
Equity Style | Large Cap/Blend |
Fixed Income Style | -- |
Broad Asset Class | -- |
Broad Category | Allocation |
Category Name | Tactical Balanced |
Category Index | Morningstar Can Neu Gbl Tgt Alloc NR CAD |
Prospectus Objective | -- |
Fund Owner Firm Name | CI Investments Inc |
Prospectus Benchmark Index | |
FTSE Canada Universe Bond | 20.00% |
ICE BofA US High Yield TR USD | 40.00% |
MSCI World GR CAD | 20.00% |
S&P/TSX Composite TR | 20.00% |
Broad Asset Class Benchmark Index | |
^SPTSX60TR | 100.0% |
Manager Tenure | |
Geof Marshall | 16.50 yrs |
Eric Bushell | 6.09 yrs |
Fundamentals
General | |
Distribution Yield | Upgrade |
Dividend Yield TTM (5-20-22) | 1.38% |
30-Day SEC Yield | -- |
7-Day SEC Yield | -- |
Number of Holdings | Upgrade |
Stock | |
Weighted Average PE Ratio | 0.0624 |
Weighted Average Price to Sales Ratio | Upgrade |
Weighted Average Price to Book Ratio | Upgrade |
Weighted Median ROE | Upgrade |
Weighted Median ROA | Upgrade |
Forecasted Dividend Yield | Upgrade |
Forecasted PE Ratio | Upgrade |
Forecasted Price to Sales Ratio | Upgrade |
Forecasted Price to Book Ratio | Upgrade |
Bond | |
Current Yield | 4.60% |
Yield to Maturity | -- |
Effective Duration | -- |
Average Coupon | Upgrade |
Average Credit Score | Upgrade |
Average Price | Upgrade |
As of April 30, 2022
Risk Info
Fund Details
Key Dates | |
Inception Date | 5/23/2008 |
Last Annual Report Date | 12/31/2018 |
Last Prospectus Date | -- |
Share Classes | |
CIG1569 | Fee-based Advice |
CIG16469 | Institutional |
CIG16569 | Commission-based Advice |
CIG19569 | Commission-based Advice |
CIG80578 | Fee-based Advice |
Attributes | |
Enhanced Index Fund | No |
Index Fund | No |
Inverse Fund | No |
Leveraged Fund | No |
Fund of Funds | No |
Currency Hedged Fund | No |
Synthetic Replication Fund | No |
Has Dividend Investment Plan | No |
Socially Responsible Fund | No |