

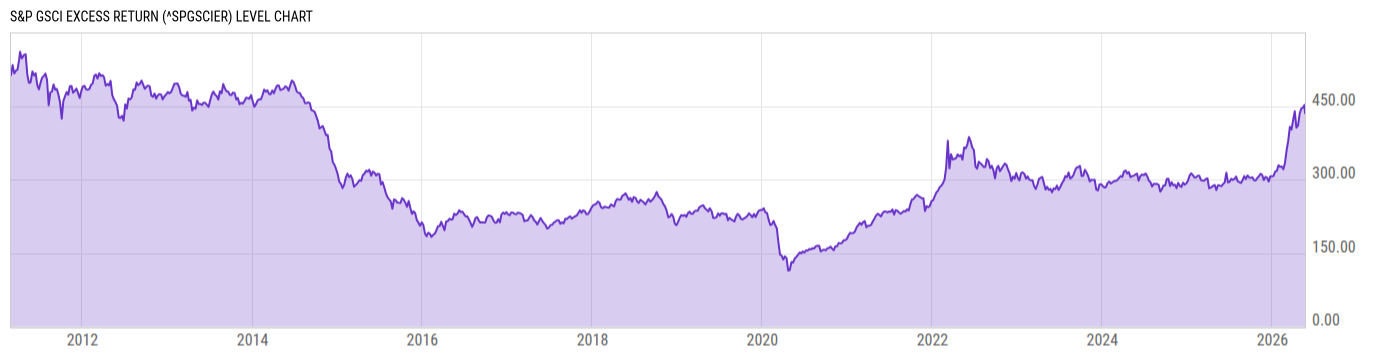
S&P GSCI Excess Return (^SPGSCIER)
445.05
+4.73
(+1.07%)
USD |
May 15, 20:00
Level Chart
Key Stats
Basic Info
| N/A | |
| Core Index Name | S&P GSCI |
| Return Type | Excess Return |
| Currency Code | USD |
| Category Hedge Type | Not Hedged |
Index Varieties
| Return Types | |
| Price Return | S&P GSCI |
| Total Return | S&P GSCI Total Return |
Total Return Performance
As of May 15, 2026.
Returns for periods of 1 year and above are annualized.
Annual Performance
As of May 16, 2026.
Basic Info
| N/A | |
| Core Index Name | S&P GSCI |
| Return Type | Excess Return |
| Currency Code | USD |
| Category Hedge Type | Not Hedged |
Index Varieties
| Return Types | |
| Price Return | S&P GSCI |
| Total Return | S&P GSCI Total Return |