

US Total Nonfarm Payrolls (I:USTNP)
158.98M for Jun 2026
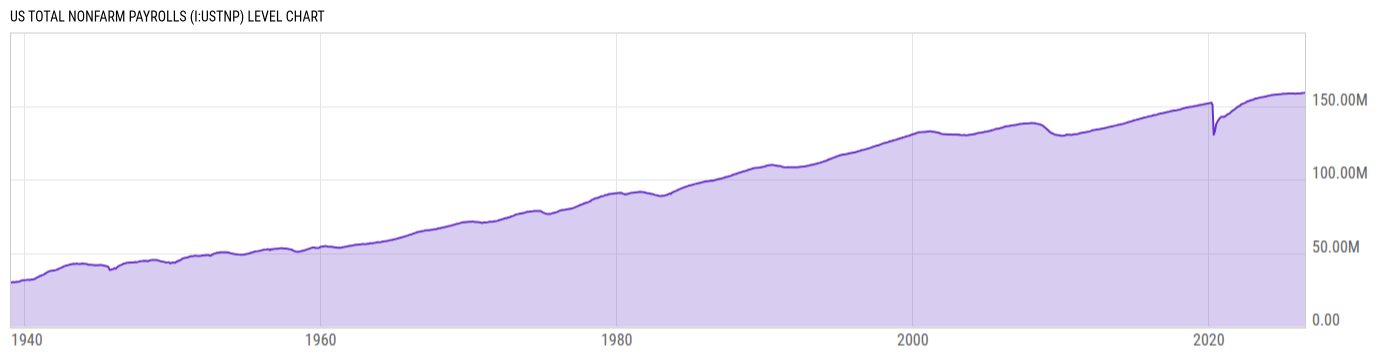
Level Chart
Basic Info
|
US Total Nonfarm Payrolls is at a current level of 158.98M, up from 158.93M last month and up from 158.48M one year ago. This is a change of 0.04% from last month and 0.32% from one year ago. |
| Report | Employment Situation |
| Categories | Employment , Hours and Wages |
| Region | United States |
| Source | Bureau of Labor Statistics |
Stats
| Last Value | 158.98M |
| Latest Period | Jun 2026 |
| Last Updated | Jul 2 2026, 08:31 EDT |
| Next Release | Aug 7 2026, 08:30 EDT |
| Average Growth Rate | 1.93% |
| Value from Last Month | 158.93M |
| Change from Last Month | 0.04% |
| Value from 1 Year Ago | 158.48M |
| Change from 1 Year Ago | 0.32% |
| Frequency | Monthly |
| Adjustment | Seasonally Adjusted |
| Download Source File |
Historical Data
| Date | Value |
|---|---|
| June 30, 2026 | 158.98M |
| May 31, 2026 | 158.93M |
| April 30, 2026 | 158.80M |
| March 31, 2026 | 158.65M |
| February 28, 2026 | 158.44M |
| January 31, 2026 | 158.59M |
| December 31, 2025 | 158.43M |
| November 30, 2025 | 158.45M |
| October 31, 2025 | 158.41M |
| September 30, 2025 | 158.55M |
| August 31, 2025 | 158.47M |
| July 31, 2025 | 158.54M |
| June 30, 2025 | 158.48M |
| May 31, 2025 | 158.50M |
| April 30, 2025 | 158.48M |
| March 31, 2025 | 158.38M |
| February 28, 2025 | 158.31M |
| January 31, 2025 | 158.27M |
| December 31, 2024 | 158.32M |
| November 30, 2024 | 158.08M |
| October 31, 2024 | 157.94M |
| September 30, 2024 | 157.91M |
| August 31, 2024 | 157.76M |
| July 31, 2024 | 157.75M |
| June 30, 2024 | 157.70M |
| Date | Value |
|---|---|
| May 31, 2024 | 157.61M |
| April 30, 2024 | 157.53M |
| March 31, 2024 | 157.47M |
| February 29, 2024 | 157.24M |
| January 31, 2024 | 157.03M |
| December 31, 2023 | 156.93M |
| November 30, 2023 | 156.66M |
| October 31, 2023 | 156.52M |
| September 30, 2023 | 156.33M |
| August 31, 2023 | 156.18M |
| July 31, 2023 | 156.02M |
| June 30, 2023 | 155.87M |
| May 31, 2023 | 155.61M |
| April 30, 2023 | 155.39M |
| March 31, 2023 | 155.17M |
| February 28, 2023 | 155.09M |
| January 31, 2023 | 154.78M |
| December 31, 2022 | 154.29M |
| November 30, 2022 | 154.16M |
| October 31, 2022 | 153.90M |
| September 30, 2022 | 153.54M |
| August 31, 2022 | 153.28M |
| July 31, 2022 | 153.04M |
| June 30, 2022 | 152.35M |
| May 31, 2022 | 151.93M |
News
Headline
Time (ET)
07/13 09:06
07/10 08:58
07/02 16:13
Basic Info
|
US Total Nonfarm Payrolls is at a current level of 158.98M, up from 158.93M last month and up from 158.48M one year ago. This is a change of 0.04% from last month and 0.32% from one year ago. |
| Report | Employment Situation |
| Categories | Employment , Hours and Wages |
| Region | United States |
| Source | Bureau of Labor Statistics |
Stats
| Last Value | 158.98M |
| Latest Period | Jun 2026 |
| Last Updated | Jul 2 2026, 08:31 EDT |
| Next Release | Aug 7 2026, 08:30 EDT |
| Average Growth Rate | 1.93% |
| Value from Last Month | 158.93M |
| Change from Last Month | 0.04% |
| Value from 1 Year Ago | 158.48M |
| Change from 1 Year Ago | 0.32% |
| Frequency | Monthly |
| Adjustment | Seasonally Adjusted |
| Download Source File |
Related Indicators
| US Labor Markets |
| US Labor Force Participation Rate | 61.50% |
| US Nonfarm Payrolls MoM | 57.00K |
| US Real Average Hourly Earnings MoM | 0.80% |
| US Real Average Hourly Earnings YoY | 0.10% |
| US U-6 Unemployment Rate | 8.20% |
| US Unemployment Rate | 4.20% |